AI Shouldn’t Make Up Numbers: Data Accuracy in LivChart
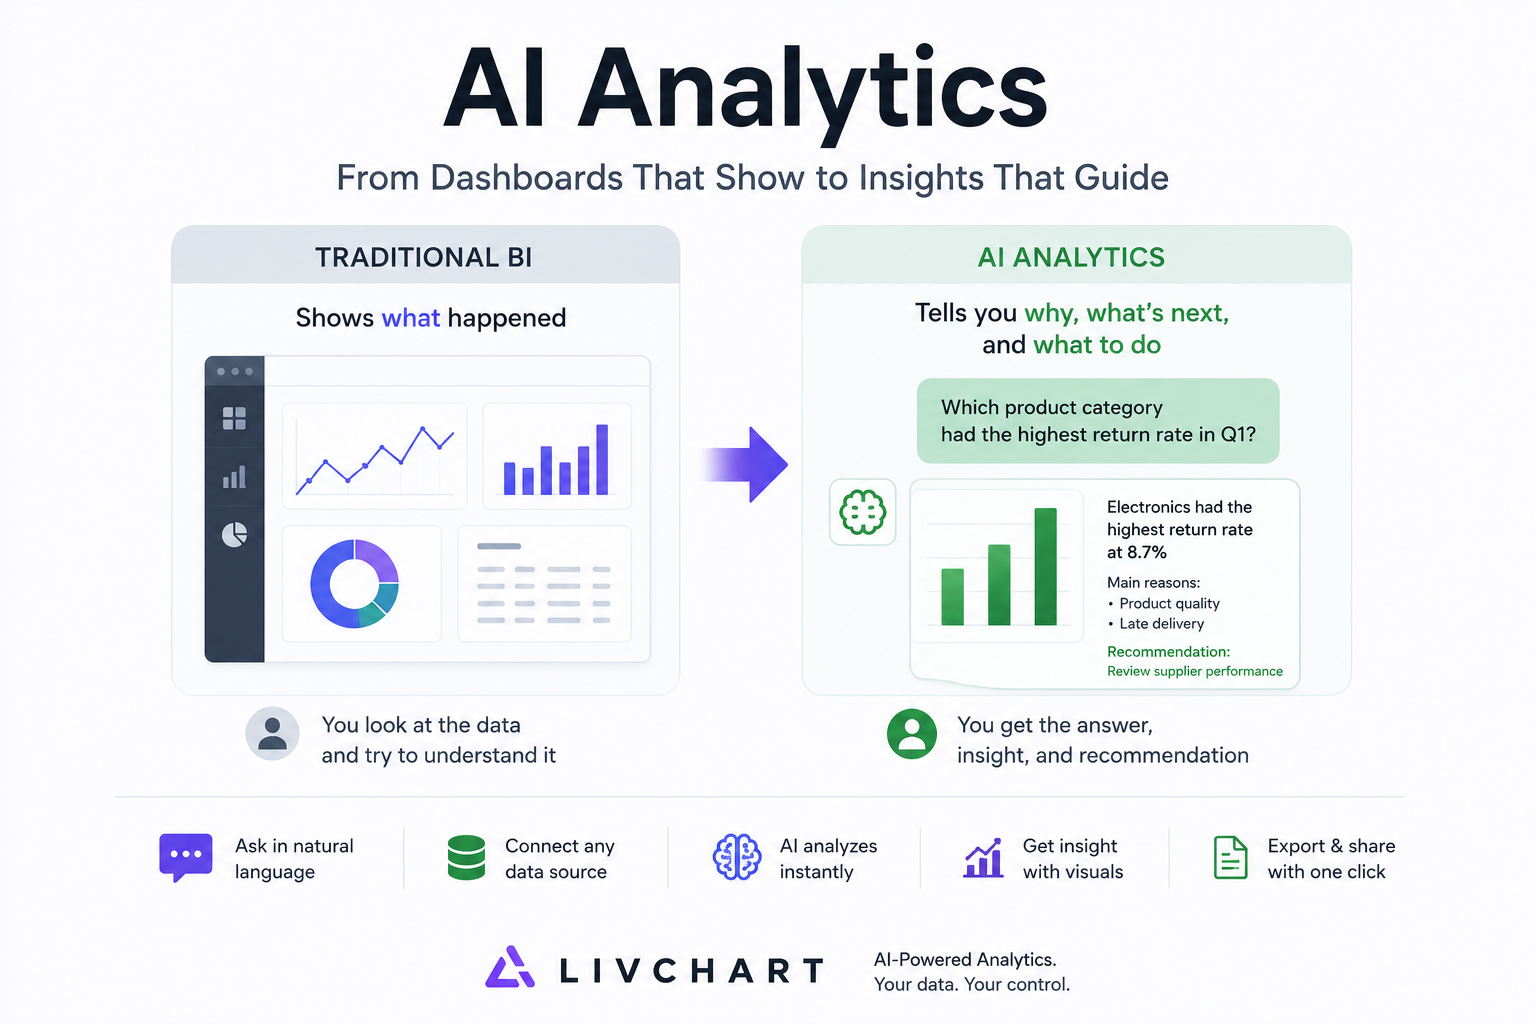
In LivChart, AI understands your question while LivChart calculates every number from your full dataset. Every figure shows its source, and unverified numbers are clearly flagged.
Read More →Guides, tips and updates on data analysis, local AI, dashboard building and PDF reporting.
In LivChart, AI understands your question while LivChart calculates every number from your full dataset. Every figure shows its source, and unverified numbers are clearly flagged.
Read More →
Local AI data analysis keeps your data on your device. No cloud uploads, no token costs, no compliance risks. Learn how DuckDB and Ollama power privacy-first analytics with LivChart.
Read More →
Which open-source AI model generates the most accurate business charts? We tested 9 models across 46 scenarios on Ollama. GLM-5.1 achieved 100% accuracy.
Read More →
Technical deep-dive into why LivChart uses DuckDB instead of PostgreSQL, SQLite, or ClickHouse for local-first AI analytics. Benchmarks, architecture decisions, and real-world performance data.
Read More →
LivChart is a local-first AI analytics platform that turns your company data into charts, dashboards and PDF reports — with a local AI model nothing leaves your device; with cloud AI only the data needed is sent, with your approval and masked. Learn how it works, who it's for, and why it's different from traditional BI tools.
Read More →
LivChart optimized Ollama models for analytics workflows, structured outputs, and local AI-powered dashboards.
Read More →
Which local AI model works best for dashboards, KPI analysis, and multilingual analytics? Compare Qwen2.5, Gemma 3, Llama 3, Mistral, and DeepSeek for real business workflows.
Read More →
As AI becomes part of reporting and operations, companies increasingly ask where their data goes. Learn how local AI analytics keeps business data inside your infrastructure.
Read More →
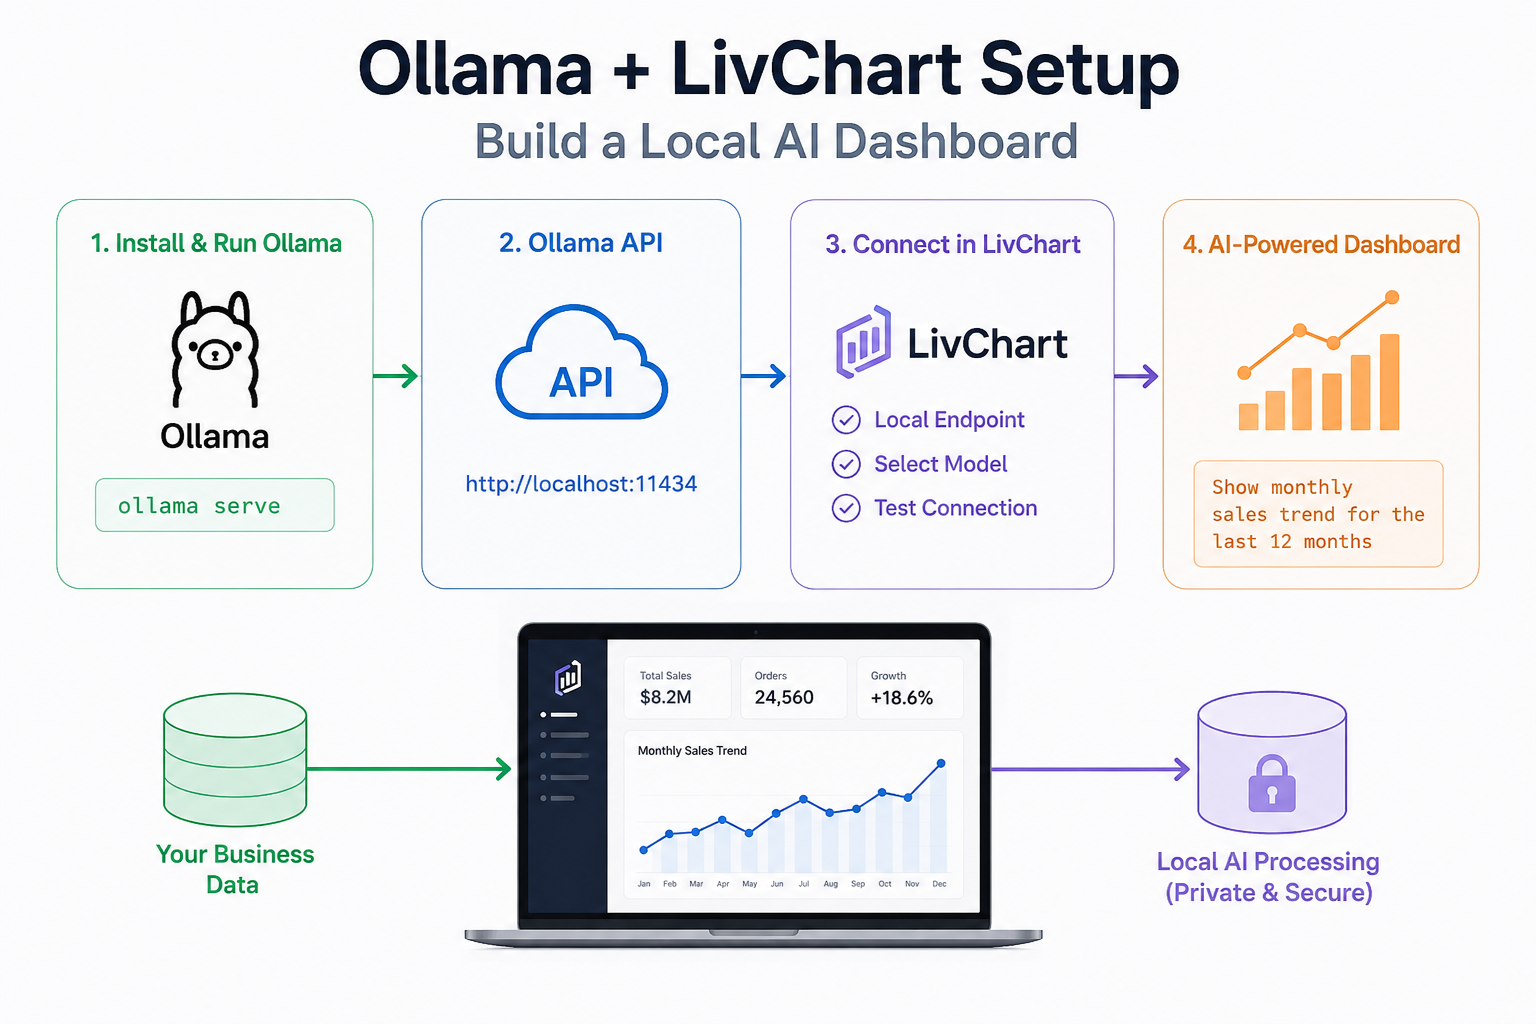
Step-by-step guide to set up Ollama with LivChart for local AI data analysis. Install models, connect dashboards, and generate charts using Qwen, Gemma, Llama, Mistral — or LivChart-optimized models — all on your own device.
Read More →
Traditional BI tools were built for a slower world. Learn why dashboards are breaking and how AI-powered analytics replaces static reporting with interactive exploration.
Read More →
Modern AI analytics combines data processing, semantic understanding, and statistical analysis in a single workflow. Learn the 5-layer architecture behind interactive analytics systems.
Read More →
As organizations adopt AI tools, they face critical compliance risks under KVKK and GDPR. Learn how cloud AI creates privacy challenges and why local AI is becoming a compliance advantage.
Read More →
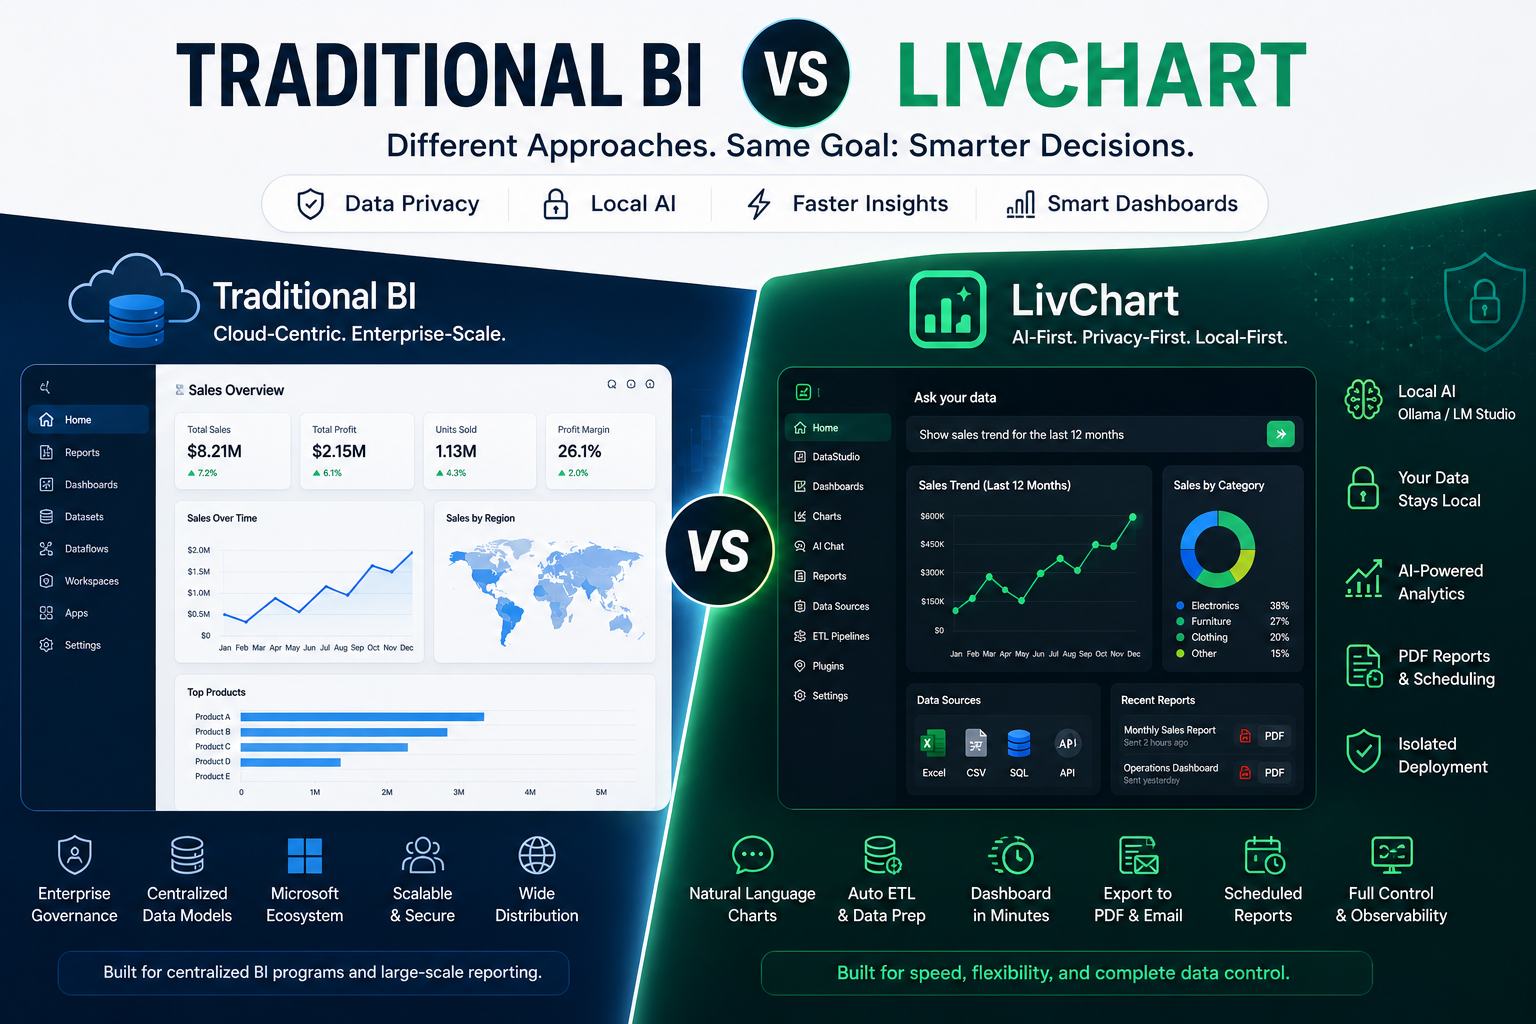
Power BI and LivChart serve different analytics needs. Compare their approaches to data processing, AI integration, privacy, and dashboard workflows to find which aligns with your requirements.
Read More →
We compared 5 local AI models across 32 LivChart Chart Wizard scenarios. Accuracy, speed, and failure patterns show which models are closer to production use.
Read More →
The fastest way to turn Excel data into professional dashboards. Visualize with AI-assisted chart wizard without coding.
Read More →
Generate professional PDF reports from dashboards instantly. Company branding, AI summaries, and high-quality charts in one click.
Read More →Analyze Excel, CSV and SQL data without moving it off your device; create dashboards and PDF reports in minutes.