The right way to compare Power BI and LivChart is to start with a fair statement: Power BI is a very strong BI platform. Inside the Microsoft ecosystem, it is mature in report authoring, sharing, governance, Microsoft 365 integration, and enterprise-scale distribution. So the point of this article is not to downplay Power BI. The point is to explain where LivChart answers a different need.
BI selection is no longer just a question of which tool draws better charts. The real decision is about where data is processed, how AI accesses that data, who prepares the report, how much technical knowledge the end user needs, and how quickly an organization can turn analysis into an operational report.
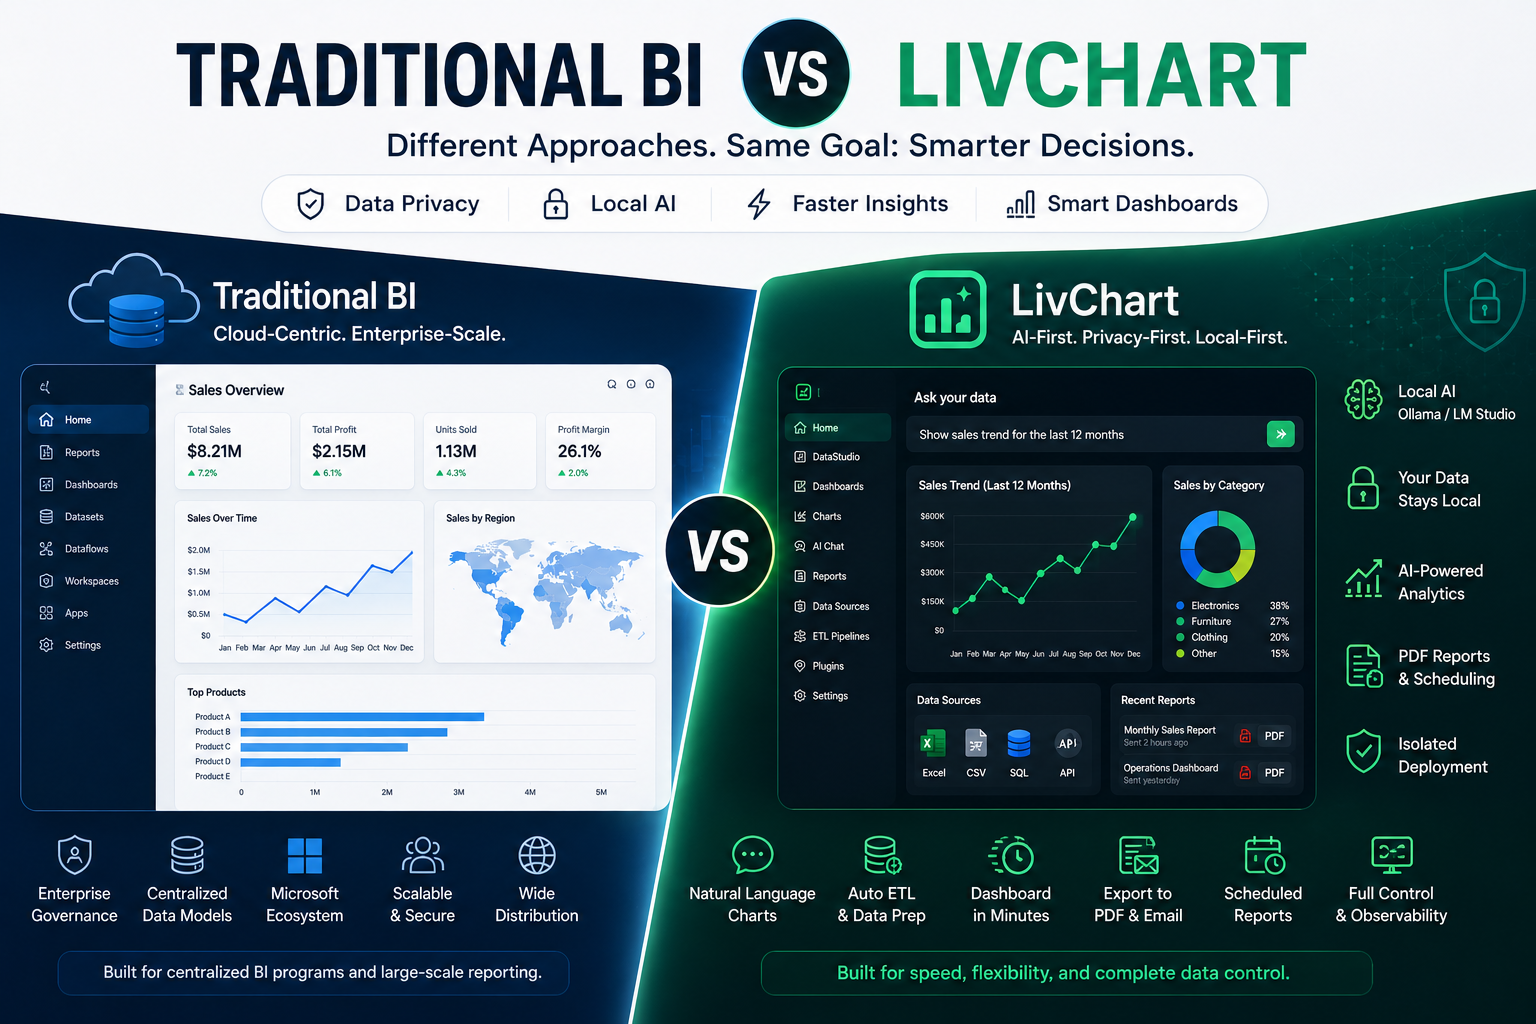
| Feature | Power BI | LivChart |
|---|---|---|
| Local AI | Limited | Yes |
| Ollama | No | Yes |
| LM Studio | No | Yes |
| Natural Language Charts | Partial | Native |
| Fast ETL | Power Query-focused | Auto ETL |
| PDF Reporting | Via ecosystem | Native |
| Local Deployment | Enterprise-focused | Built-in |
| Dashboard Sharing | Yes | Yes |
| AI Policy Control | Microsoft tenant model | Flexible / Local |
| DuckDB Analytics | No | Built-in |
Where Power BI is strong
Microsoft’s Power BI product page positions Power BI as part of a broader data platform that works with Microsoft Fabric, OneLake, Microsoft 365, Teams, Excel, and Power Platform. For organizations already invested in Microsoft infrastructure, that is a major advantage.
Power BI’s strengths can be summarized fairly:
- Enterprise BI backbone: It is strong for centralized semantic models, report sharing, workspace management, and governance.
- Microsoft ecosystem: It works closely with Excel, Teams, PowerPoint, SharePoint, Dynamics, and Fabric.
- Large-scale distribution: It fits scenarios where reports are distributed to many users through centralized data models and IT-controlled processes.
- Broad market and community: It has a large ecosystem of training resources, consultants, connectors, and report examples.
- Fabric and Copilot direction: Microsoft continues to develop Power BI as part of an AI-assisted analytics and data platform in Fabric.
In other words, Power BI is a natural option for organizations with a Microsoft-centered enterprise BI strategy. If your goal is a governed BI architecture built on Microsoft Fabric and distributed to thousands of users, Power BI should be evaluated seriously.
Where the decision changes
Many teams have a different need. A single analyst, a department, an operations team, or an organization working with sensitive data may need fast data preparation, natural-language chart creation, local processing, PDF output, and AI control before they need a full report publishing platform.
These questions become important:
- Can we analyze data before moving it into a centralized cloud ecosystem?
- When using AI, can we control which model, server, and region handles the data?
- Can we go from Excel, CSV, SQL, or web service data to a dashboard in a few steps?
- Can a non-technical user create charts with natural language?
- Can a dashboard become a meeting-ready PDF or email report without extra tooling?
LivChart is positioned around these questions.
LivChart’s different approach: AI-first and privacy-first BI
LivChart is designed less like a traditional BI tool and more like a combined workflow for AI-assisted data preparation, chart creation, dashboarding, and reporting. The core difference is that it shortens the path from data to insight instead of starting with complex modeling and report design.
LivChart differs in several areas:
- Local and isolated AI options: LivChart can work with local providers such as Ollama or LM Studio, supporting scenarios where data does not leave the organization. Teams can use cloud AI, LivAI Cloud, or a local model in a closed environment.
- Natural-language chart creation: Users can create metric-spec based charts with requests such as “show the sales trend for the last 12 months” or “compare profitability by country.”
- DataStudio and Auto ETL: LivChart supports extracting, cleaning, transforming, enriching, and analyzing data from Excel, CSV, SQL, and web service sources on a fast DuckDB-based local data layer.
- Presentation-ready reporting: Dashboards can be exported to PDF, emailed, and connected to scheduled report jobs.
- Operational control: LivChart includes user management, sharing, public links, alerts, telemetry, health checks, plugin management, and ERP package workflows.
That is why calling LivChart only a “Power BI alternative” is incomplete. A better description is this: LivChart is a different operating model for AI-assisted BI and local data analysis.
From individual users to enterprise use
Individual users
A consultant, finance specialist, or operations manager can upload an Excel or CSV file and create charts quickly with natural language. In this scenario, the goal is not to launch a large BI program; it is to understand the data and create a shareable output quickly.
Teams and departments
For sales, manufacturing, finance, or logistics teams, LivChart accelerates daily reporting with reusable ETL flows, dashboards, favorite charts, PDF reports, email delivery, and scheduled tasks.
Enterprise
At enterprise level, LivChart’s difference appears in AI policy, local or isolated deployment, user authorization, dashboard sharing, health checks, telemetry, plugin architecture, and ERP app/package mechanisms. This matters for organizations that work with sensitive data, want controlled AI usage, or need to run some analytics workloads independently from a centralized cloud platform.
How should Power BI and LivChart be compared?
It is not always accurate to say one replaces the other. A healthier comparison starts with the operating model.
- Power BI: Strong for Microsoft-centered enterprise BI, centralized semantic models, governance, broad sharing, and the Fabric ecosystem.
- LivChart: Strong for local AI, fast data preparation, natural-language chart creation, sensitive data control, PDF/email reporting, and isolated deployment scenarios.
Power BI sharing and licensing scenarios are shaped by the enterprise model. Microsoft’s official pricing page lists Free, Pro, Premium Per User, Embedded, and Fabric Capacity options. Microsoft’s Publish to web documentation also clearly states that public publishing is not suitable for confidential or proprietary information. That is not a weakness of Power BI; it is a reminder that the right sharing model matters.
The real AI difference
Microsoft’s Copilot in Fabric documentation explains how Copilot can assist with data analysis, report creation, and summaries across Fabric and Power BI. That is powerful, but it also has to be considered together with Fabric capacity, tenant settings, regional data processing, and governance decisions.
LivChart gives teams more flexibility in AI deployment: they can use an online provider, LivAI Cloud, or a fully local model in a closed environment. For teams handling customer data, production data, financial data, or regulated data, that choice can be strategic.
When Power BI makes sense
- You are already invested in Microsoft 365, Fabric, Teams, SharePoint, and Azure.
- Your priority is a centralized semantic model and strong enterprise governance.
- You need to distribute standardized BI content to a large report-consuming audience.
- You are building a long-term enterprise BI program managed by IT.
When LivChart makes sense
- You want AI-assisted analytics while keeping data in a local or controlled environment.
- You want fast ETL and dashboard creation from Excel, CSV, SQL, or web service sources.
- You need fast reporting and PDF output for individual users, teams, or departments.
- You want chart creation, chart editing, and data explanation through natural language.
- You need isolated deployment, AI policy, plugins, and operational health checks at enterprise level.
Conclusion: Not the same race, a different working model
Power BI is a very strong enterprise BI platform inside the Microsoft ecosystem. LivChart answers a different question: “How can I analyze my data with more control, more speed, and AI assistance, then turn it into dashboards and presentation-ready reports?”
That is why LivChart is not only a Power BI alternative. LivChart is a different BI approach built around local AI BI, data privacy, fast ETL, natural-language chart creation, and operational reporting from individual use to enterprise deployment.
You can start with your own Excel or CSV file in LivChart Playground, or request a demo to evaluate local AI and enterprise deployment scenarios for your organization.