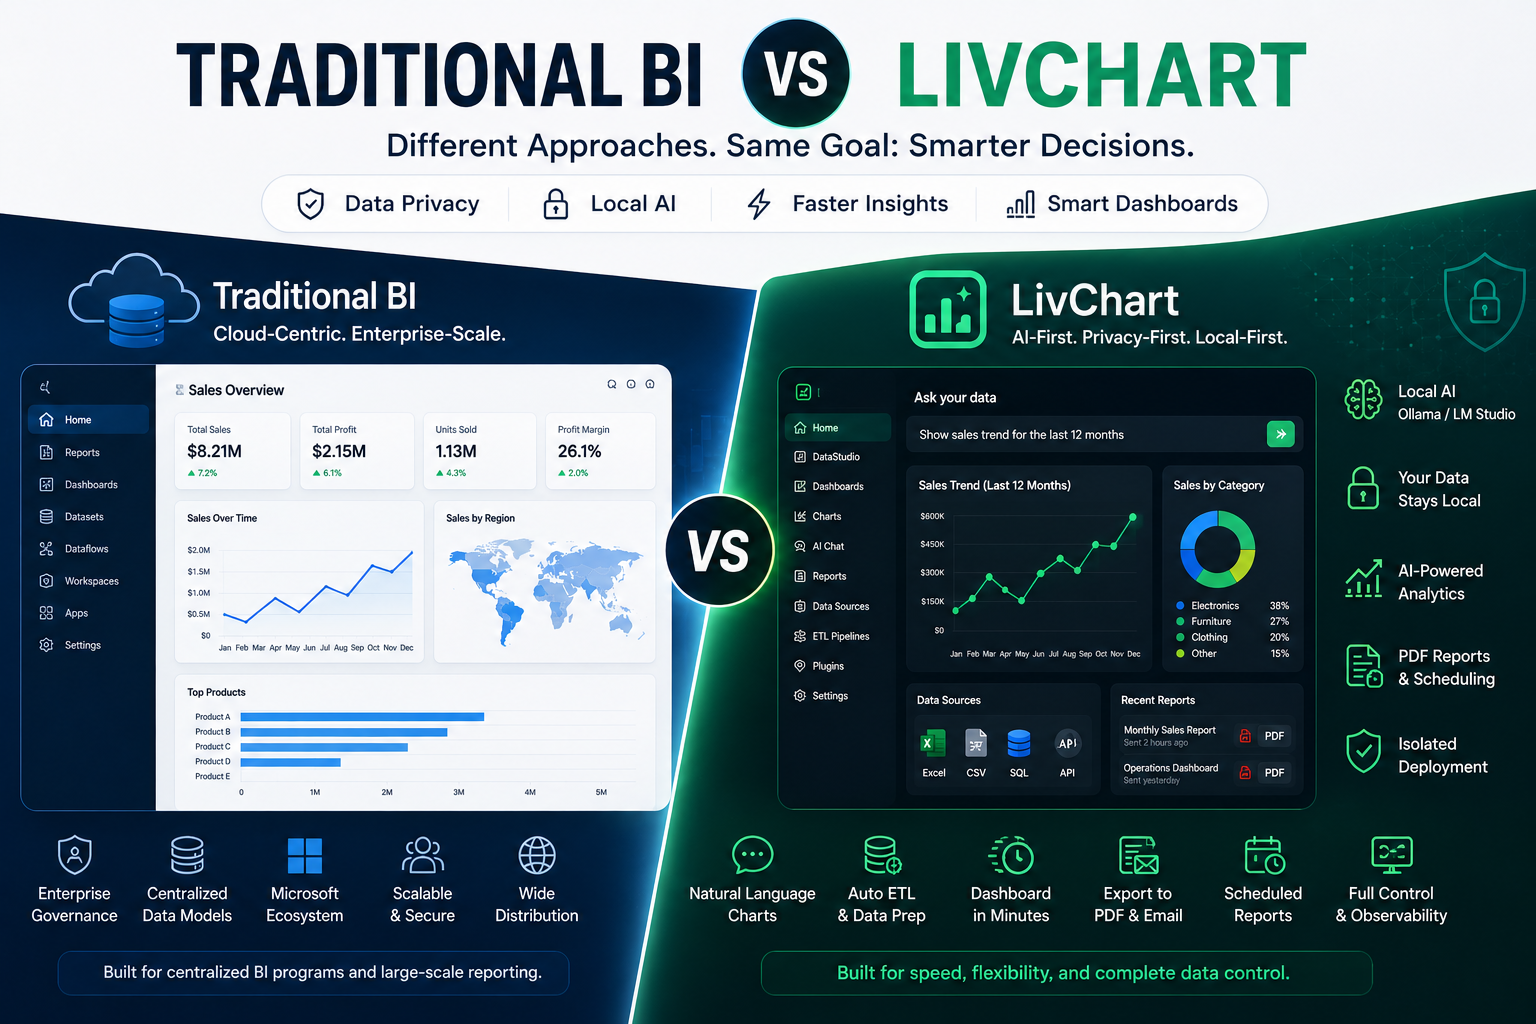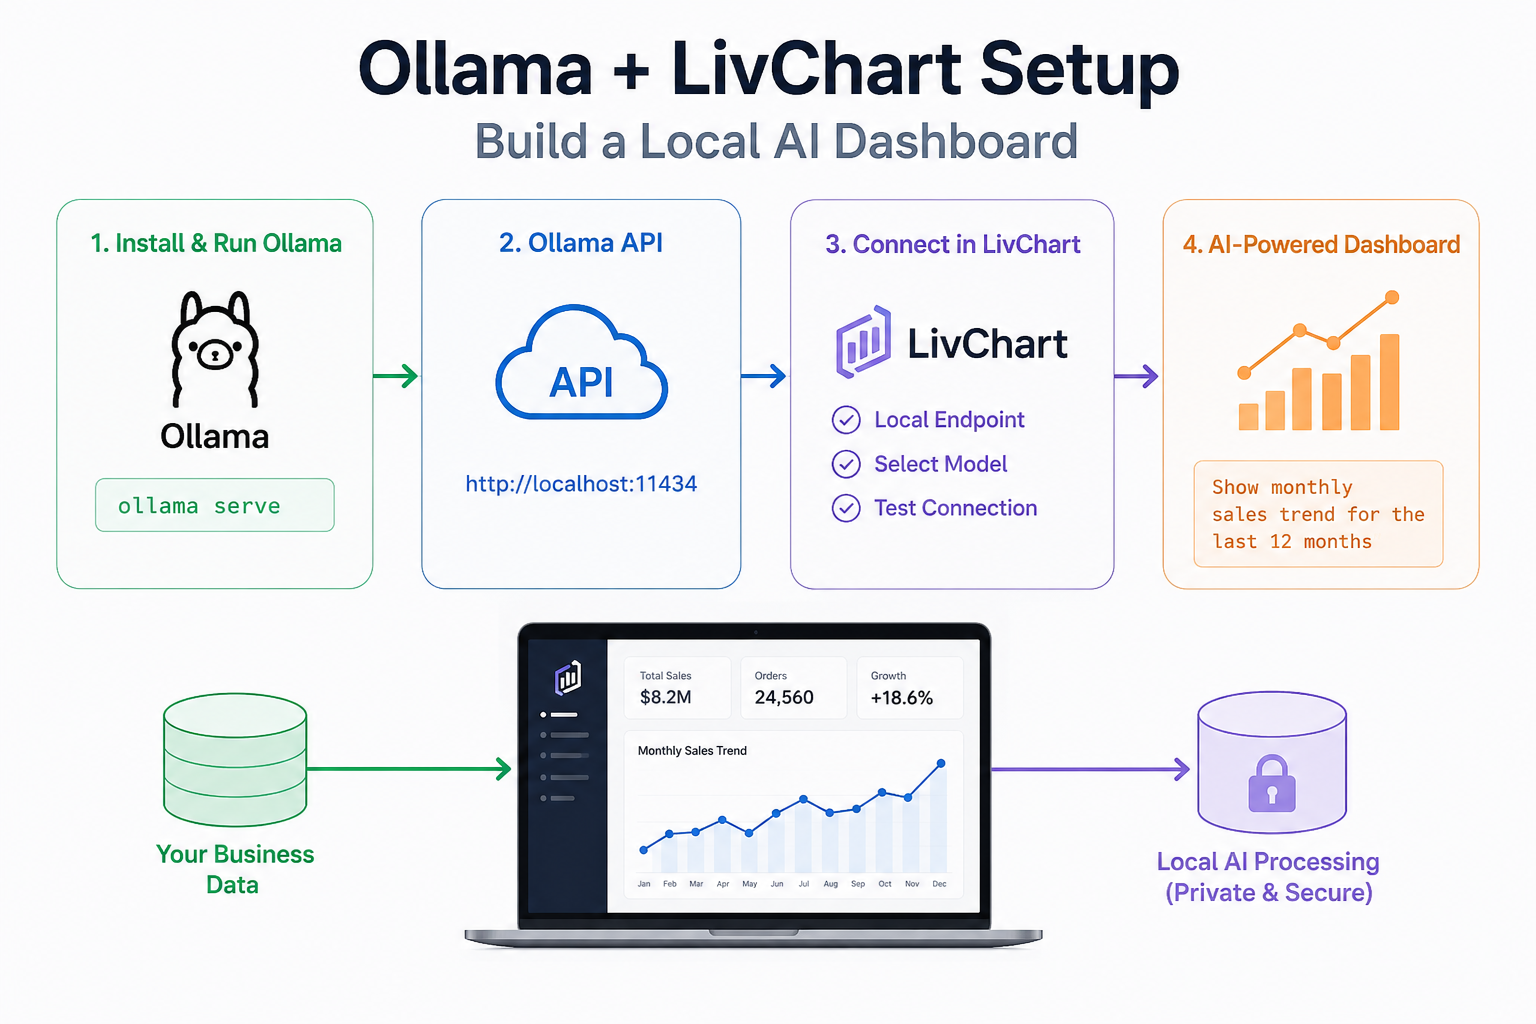
Ollama + LivChart Setup Guide: Local AI Dashboard in Minutes
Step-by-step guide to set up Ollama with LivChart for local AI data analysis. Install models, connect dashboards, and generate charts using Qwen, Gemma, Llama, Mistral — or LivChart-optimized models — all on your own device.
Read More →