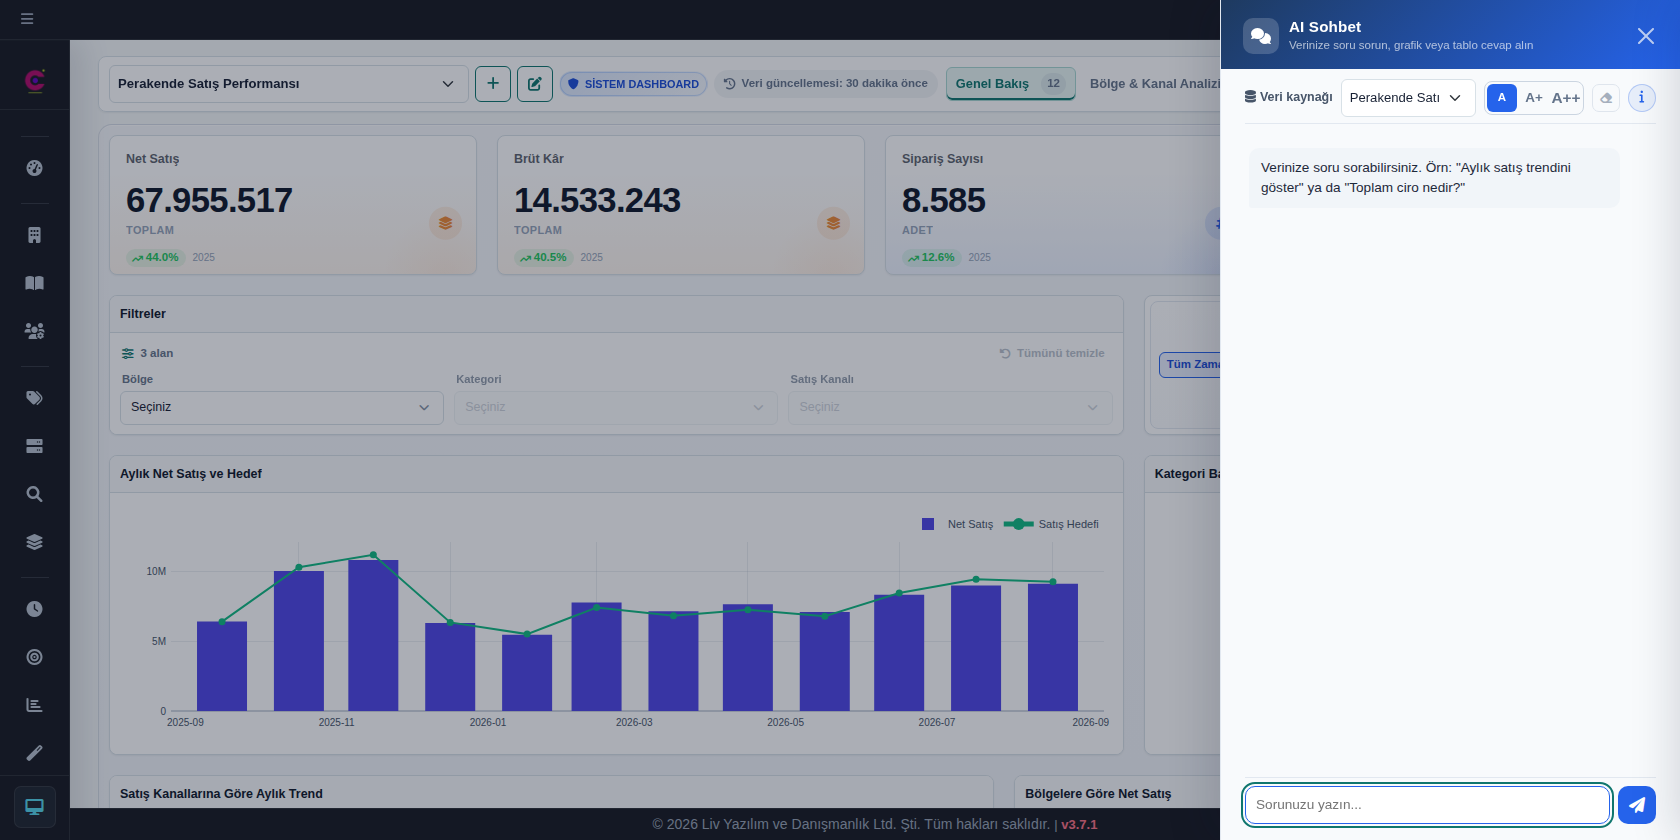
AI Shouldn’t Make Up Numbers: Data Accuracy in LivChart
In LivChart, AI understands your question while LivChart calculates every number from your full dataset. Every figure shows its source, and unverified numbers are clearly flagged.
Read More →Articles on AI-powered analytics, automated insights, and intelligent data interpretation.
AI analytics goes beyond traditional reporting screens by turning data into automated insights, natural-language explanations, and decision support. This category covers AI-assisted data analysis, chart recommendations, dashboard interpretation, and practical ways for business users to discover insights without depending on technical teams.
In the LivChart context, these articles explain how data from Excel, CSV, and databases can be understood faster, how local or cloud AI models can support secure analysis, and where artificial intelligence creates real value in modern BI workflows.
In LivChart, AI understands your question while LivChart calculates every number from your full dataset. Every figure shows its source, and unverified numbers are clearly flagged.
Read More →
Which open-source AI model generates the most accurate business charts? We tested 9 models across 46 scenarios on Ollama. GLM-5.1 achieved 100% accuracy.
Read More →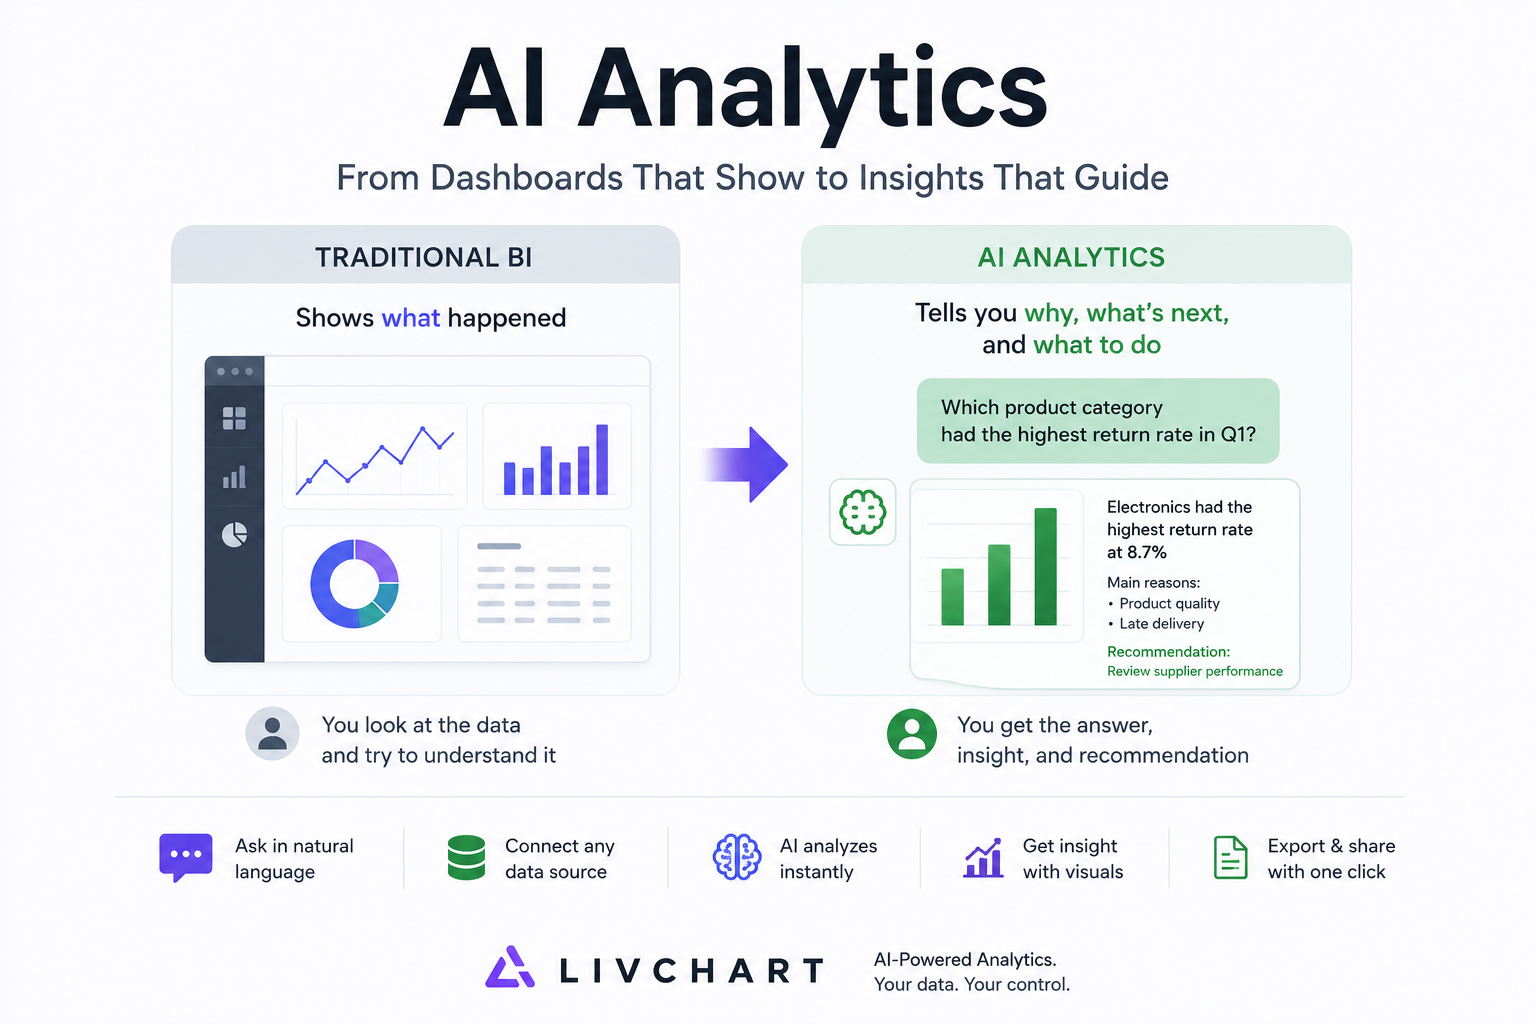
Modern AI analytics combines data processing, semantic understanding, and statistical analysis in a single workflow. Learn the 5-layer architecture behind interactive analytics systems.
Read More →
We compared 5 local AI models across 32 LivChart Chart Wizard scenarios. Accuracy, speed, and failure patterns show which models are closer to production use.
Read More →