Most people think AI analytics is just ChatGPT connected to a dashboard.
It isn't.
Modern AI analytics systems combine multiple layers of data processing, semantic understanding, statistical analysis, and visualization into a single workflow.
When someone types:
Which region caused the revenue decline last quarter?
a modern AI analytics system performs dozens of operations in seconds.
It identifies the relevant data, generates queries, performs calculations, selects visualizations, explains the result, and often recommends what to investigate next.
This article explains how AI analytics systems actually work behind the scenes.
The Shift from Dashboards to Interactive Analysis
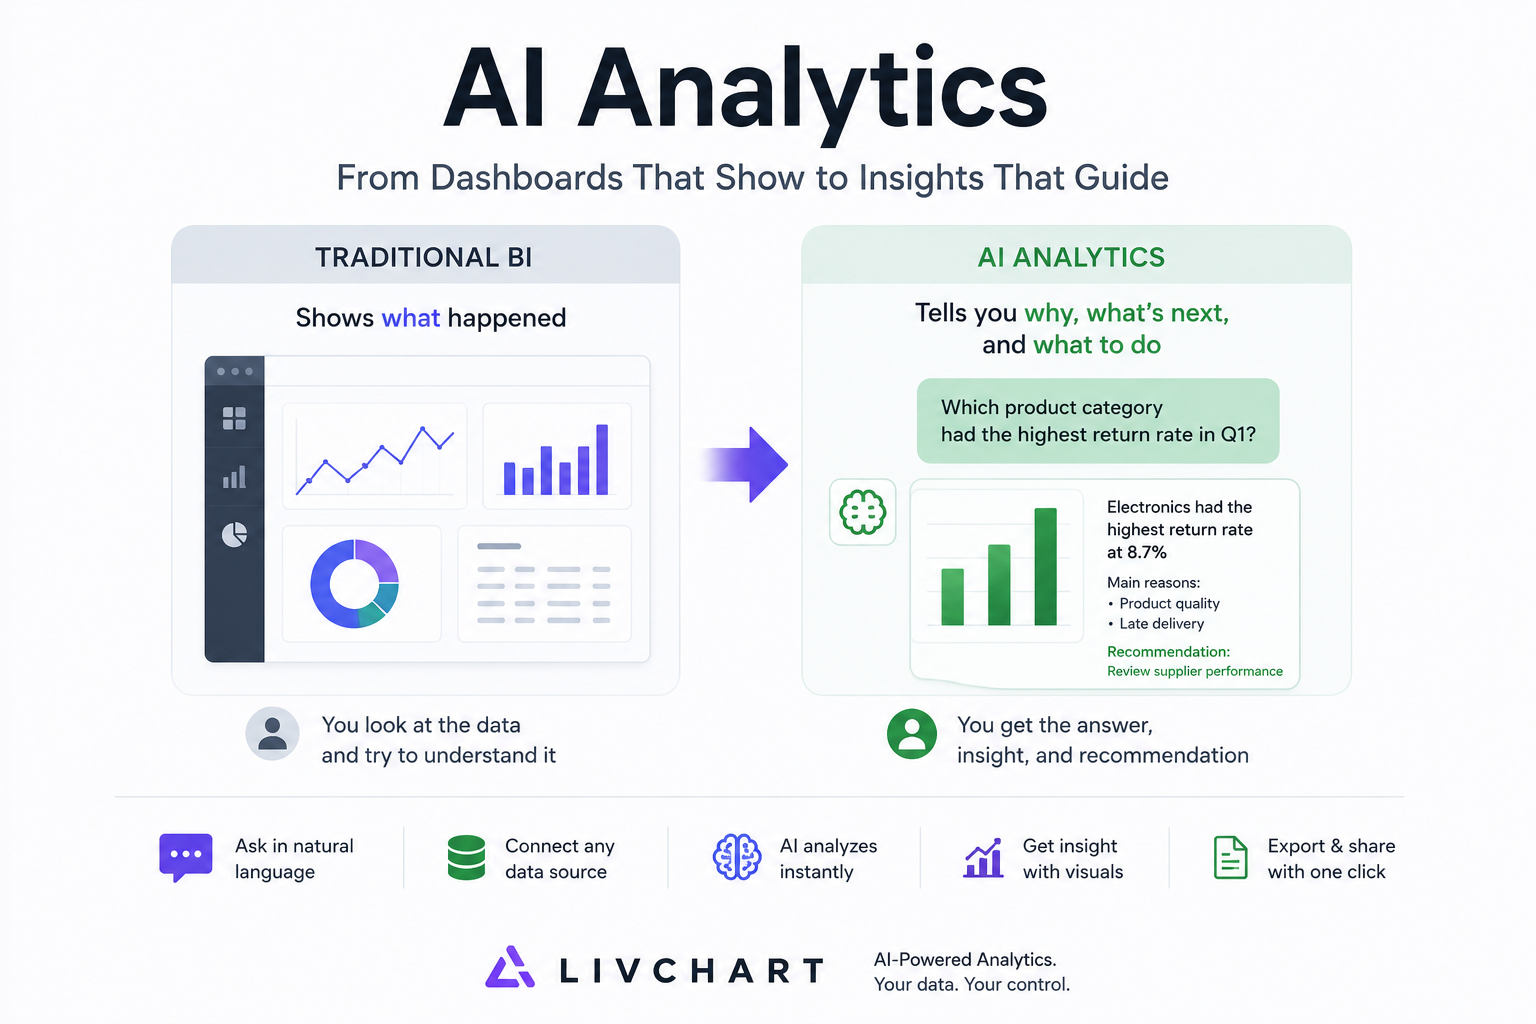
Traditional dashboards were designed around predefined questions.
Someone builds the dashboard first.
Then users consume the dashboard later.
AI analytics reverses the workflow.
The question comes first.
The dashboard is generated dynamically.
That changes the entire architecture of business intelligence systems.
The 5-Layer Architecture of AI Analytics
Modern AI analytics platforms usually operate through five major layers:
- Data Connection
- Intent Understanding
- Analysis & Computation
- Visualization & Explanation
- Action & Workflow Integration
Each layer solves a different problem.
Together, they create an interactive analytics system.
Layer 1 — Data Connection
Everything starts with data access.
Modern AI analytics platforms connect directly to business data sources such as:
- Excel files
- CSV datasets
- SQL Server
- PostgreSQL
- MySQL
- ERP databases
- ODBC connections
- cloud warehouses
Traditional BI systems often require heavy modeling before analysis begins.
AI analytics platforms increasingly reduce that dependency.
Instead of requiring users to manually define every relationship, the system automatically detects:
- tables
- columns
- data types
- foreign keys
- date fields
- metric candidates
This allows teams to start analysis significantly faster.
Layer 2 — Intent Understanding
This is where AI analytics becomes fundamentally different from dashboards.
When a user types:
Show me monthly sales trends for Europe
the system must understand:
- sales = metric
- monthly = time grouping
- Europe = filter
- trends = line chart candidate
This process is called semantic intent understanding.
Modern systems use large language models to interpret natural language and translate it into structured operations.
The AI must determine:
- what data the user wants
- how it should be grouped
- which filters apply
- which calculations are required
- which visualization fits best
This is not keyword matching.
The system interprets meaning.
Layer 3 — Analysis and Computation
After understanding intent, the platform performs analysis.
This layer may include:
- SQL generation
- aggregation
- statistical calculations
- trend analysis
- segmentation
- forecasting
- anomaly detection
- correlation analysis
For example, if the user asks:
Which customers are likely to churn?
the AI may analyze:
- purchase frequency
- order recency
- revenue decline
- behavioral patterns
The user does not need to manually define these analytical steps.
The AI selects methods dynamically based on the question and available data.
Layer 4 — Visualization and Explanation
Traditional dashboards stop at visualization.
AI analytics continues further.
The system generates:
- charts
- explanations
- summaries
- observations
- contextual insights
This changes how people consume analytics.
Instead of only seeing a declining chart, users may receive explanations such as:
Revenue declined 14% in the EMEA region, primarily driven by enterprise customer churn in Germany and France.
The chart becomes part of a larger analytical narrative.
This is one of the biggest differences between traditional BI and AI analytics.
Layer 5 — Action and Workflow Integration
The final layer transforms insights into operational workflows.
Modern AI analytics systems increasingly support:
- report generation
- dashboard export
- recurring analysis
- scheduled monitoring
- alerts
- collaborative sharing
- PDF generation
- presentation-ready summaries
The goal is not just analysis.
The goal is decision acceleration.
Why This Architecture Matters
Traditional BI systems scale slowly because every new question requires manual work.
AI analytics systems reduce friction between:
- question
- analysis
- visualization
- explanation
- action
This allows organizations to move from static reporting toward continuous exploration.
Example Workflow
A typical AI analytics interaction may look like this:
User Question
Which product categories had declining profit margins this quarter?
AI Processing
The system:
- identifies revenue and cost fields
- calculates profit margin
- compares current vs previous quarter
- groups results by category
- selects visualization
- generates explanation
Final Output
The user receives:
- chart
- analysis summary
- trend explanation
- follow-up suggestions
within seconds.
The Role of Local AI
An increasing number of businesses are now deploying AI analytics systems locally.
Instead of sending sensitive business data to cloud AI providers, companies are beginning to run models internally using tools like:
- Ollama
- LM Studio
- llama.cpp
This enables organizations to build AI-assisted analytics workflows while maintaining infrastructure control.
Platforms like LivChart combine these workflows with dashboard generation and analytics interfaces.
Challenges of AI Analytics
AI analytics systems also introduce technical challenges.
Data Quality
Poorly structured data still creates poor analysis.
Context Understanding
AI models may misunderstand ambiguous business terminology.
Infrastructure Requirements
Large models may require GPU acceleration and higher memory capacity.
Governance
Organizations increasingly need policies around:
- AI-generated insights
- auditability
- model reliability
- infrastructure management
AI Analytics Is Becoming Infrastructure
The biggest shift is architectural.
AI analytics is no longer just a reporting feature.
It is becoming part of:
- operational systems
- ERP workflows
- internal reporting
- executive decision-making
- analytics infrastructure
The companies adopting AI analytics successfully are not simply replacing dashboards.
They are redesigning how teams interact with business data entirely.
Final Thoughts
AI analytics systems combine natural language understanding, statistical analysis, visualization, and workflow automation into a single interaction model.
This changes business intelligence from a static reporting process into an interactive analytical system.
As local AI infrastructure continues improving, organizations are gaining more flexibility in how these systems are deployed, controlled, and integrated into daily operations.
The future of analytics is not static dashboards.
It is conversational, adaptive, and AI-assisted.