Local AI workflows are becoming increasingly popular for business analytics, dashboard generation, and AI-assisted reporting.
With Ollama and LivChart, teams can run AI models locally and create dashboards without relying on external cloud AI services.
In this guide, we will:
- Install Ollama
- Download a local AI model
- Start the Ollama API service
- Connect Ollama to LivChart
- Generate an AI-powered dashboard
- Review recommended models for analytics workflows
This tutorial focuses on practical setup and configuration.
What You Need
Before starting, make sure you have:
- A Windows, Linux, or macOS system
- At least 16 GB RAM recommended
- Internet connection for model download
- LivChart installed or accessible
- Basic terminal access
For larger models and faster performance, a dedicated GPU is recommended.
Step 1 — Install Ollama
Ollama allows you to run large language models locally on your machine.
macOS
Install using Homebrew:
brew install ollamaLinux
Run the official installation script:
curl -fsSL https://ollama.com/install.sh | shWindows
Download and install Ollama from the official website.
After installation, verify the setup:
ollama --versionStep 2 — Download a Local AI Model
Once Ollama is installed, download a model.
Example:
ollama run qwen2.5This command downloads the model and launches an interactive local AI session.
You can also try other models:
Gemma 3
ollama run gemma3Llama 3
ollama run llama3Mistral
ollama run mistralThe first run may take several minutes depending on model size and internet speed.
Step 3 — Start the Ollama API Service
LivChart communicates with Ollama through its local API service.
Start the API server:
ollama serveBy default, Ollama runs on:
http://localhost:11434You can test the API using:
curl http://localhost:11434/api/tagsIf everything is working correctly, Ollama will return the list of installed models.
Step 4 — Open LivChart
LivChart supports local AI integrations for dashboard and analytics workflows.
Open LivChart and navigate to the AI configuration section.
You will typically configure:
- AI provider
- Local API endpoint
- Model selection
- Connection settings
Use the local Ollama endpoint:
http://localhost:11434Then select your installed model.
Example:
qwen2.5
gemma3
llama3
After saving the configuration, test the connection.
Step 5 — Create Your First AI Chart
Once LivChart is connected to Ollama, you can start generating charts using natural language.
Example prompts:
Sales Dashboard
Show monthly sales trends for the last 12 months
Inventory Analysis
Create a chart for low-stock products by warehouse
Revenue Comparison
Compare quarterly revenue and expenses
Production Analytics
Visualize production downtime by machine
LivChart will generate dashboard components and charts based on your prompts.
Because the model runs locally through Ollama, the workflow remains fully self-hosted.
Recommended Ollama Models for Analytics
Different models behave differently in analytics workflows.
Here are some practical recommendations.
| Model | Speed | Turkish Support | Analytics Quality | Hardware Need |
|---|---|---|---|---|
| Qwen2.5 | High | Excellent | Very Good | Medium |
| Gemma 3 | Medium | Good | Good | Medium |
| Llama 3 | Medium | Medium | Good | Medium |
| Mistral | Fast | Medium | Moderate | Low |
For Turkish business analytics workflows, Qwen models often perform particularly well.
Common Setup Problems
Ollama API Not Responding
Make sure the service is running:
ollama serveCheck whether port 11434 is already in use.
Model Not Found
Verify installed models:
ollama listCommon Setup Problems
Ollama API Not Responding
Make sure the service is running:
ollama serveCheck whether port 11434 is already in use.
Model Not Found
Verify installed models:
ollama listDownload the missing model again if necessary.
Slow Performance
Large models may require:
- More RAM
- GPU acceleration
- Smaller quantized models
You can also try lighter models for faster dashboard generation.
Firewall or Local Network Issues
Some operating systems block local API access.
Verify that:
- localhost access is allowed
- firewall rules permit port 11434
- security software is not blocking Ollama
Recommended Hardware
For lightweight analytics workflows:
- Modern CPU
- 16 GB RAM
For larger AI dashboards:
- NVIDIA GPU recommended
- 32 GB+ RAM
- SSD storage
GPU acceleration can significantly improve chart generation speed and response times.
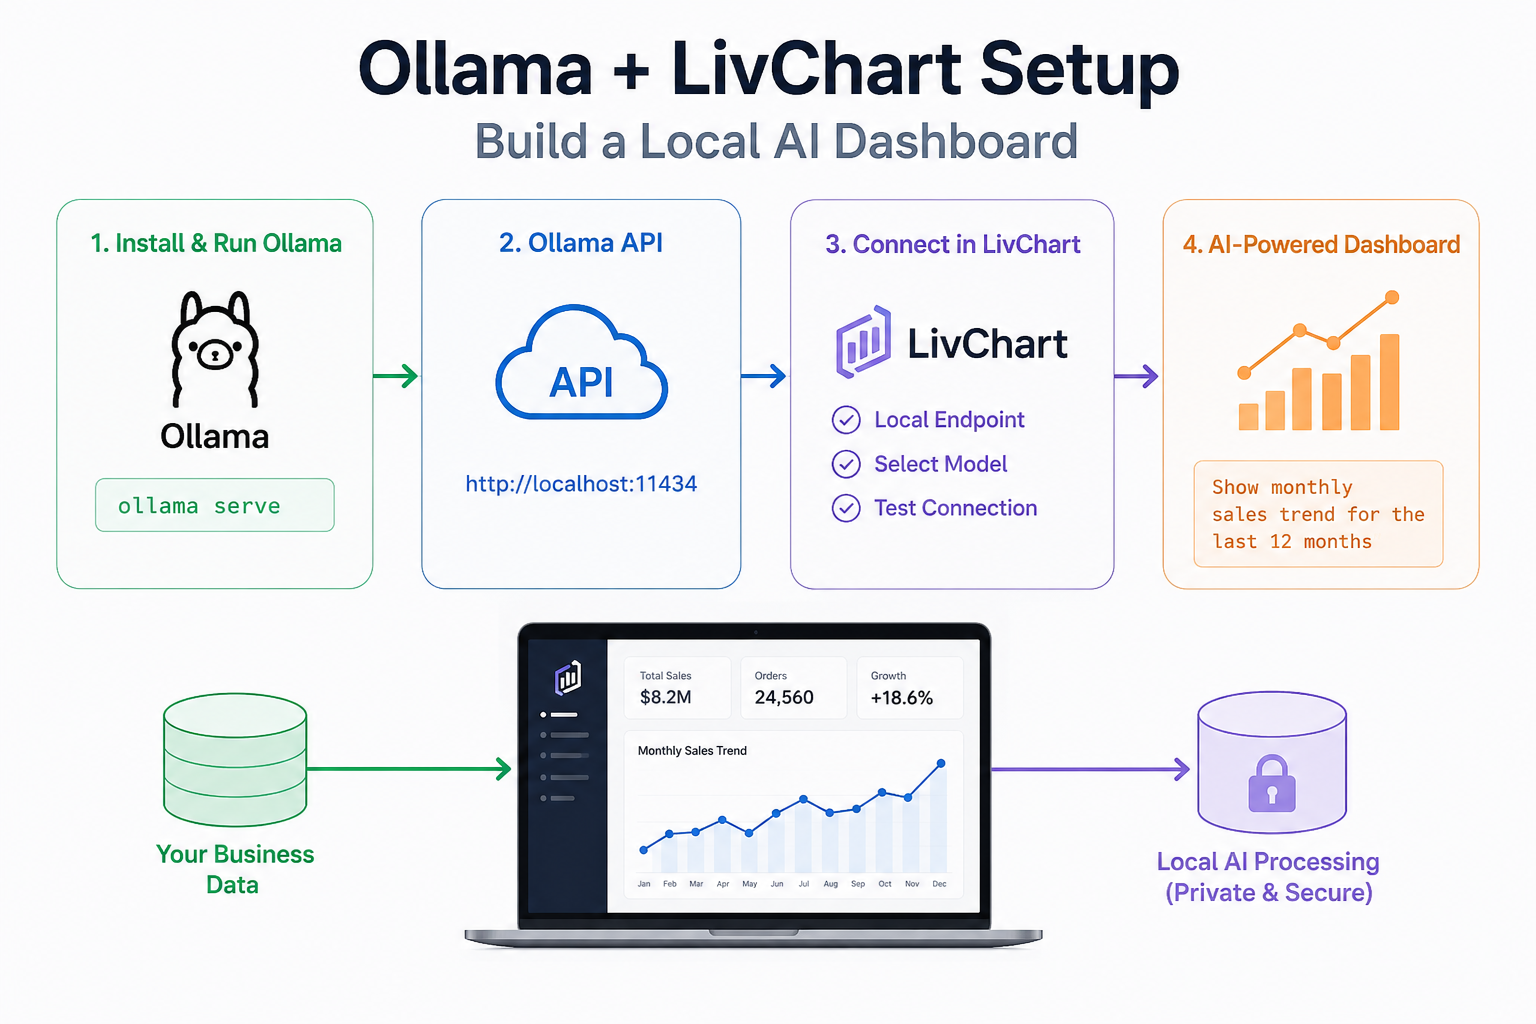
Example Local AI Analytics Workflow
A typical setup may look like this:
- Business data enters LivChart
- Ollama processes prompts locally
- AI generates charts and dashboard suggestions
- Users refine analytics interactively
- Dashboards remain inside company infrastructure
This approach combines AI-assisted analytics with local infrastructure flexibility.
Final Thoughts
Ollama and LivChart provide a practical way to build local AI-powered dashboard systems.
Instead of relying entirely on external cloud AI services, organizations can run models locally and integrate them directly into analytics workflows.
For teams exploring self-hosted AI dashboards, this setup offers:
- local AI processing
- flexible model selection
- AI-assisted chart generation
- reduced cloud dependency
- fully customizable analytics workflows
As local AI adoption continues growing, combining Ollama with LivChart can help organizations create faster and more flexible analytics environments using their own infrastructure.