Most teams think AI analytics means prettier charts. It doesn't. AI analytics replaces the question with the answer — and that changes everything about how you run your business.
The Dashboard Problem You Don't Know You Have
You open your BI tool every morning. You see charts. You see KPIs. You see trends going up and down. And then you do the hardest part: you interpret them.
That's the gap.
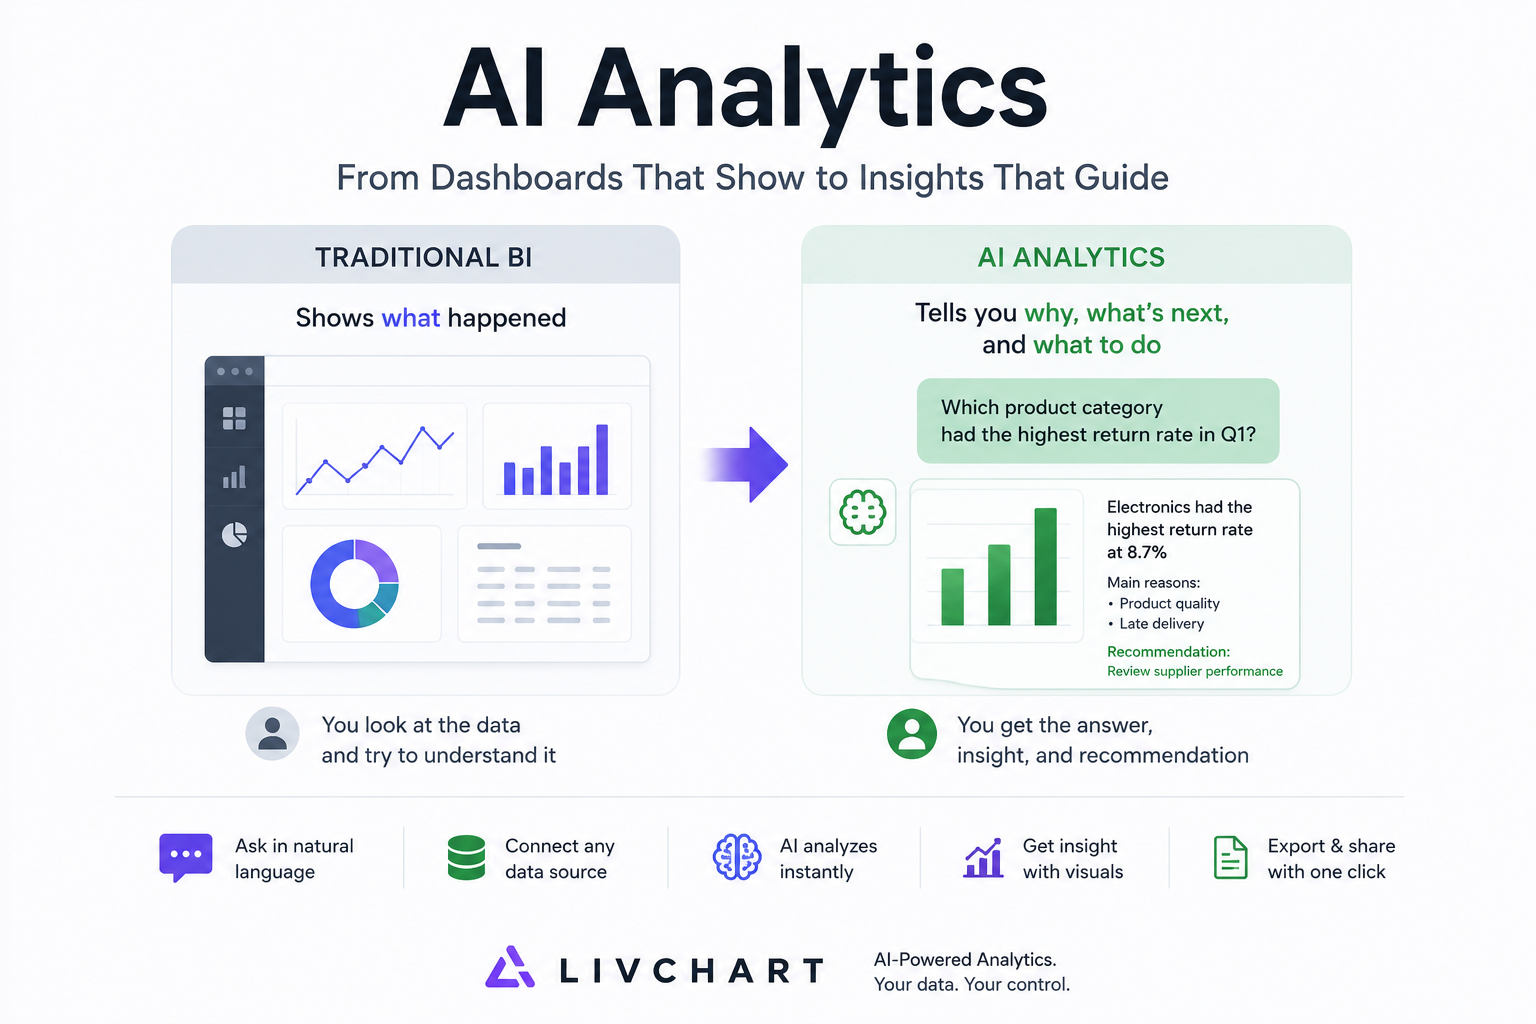
A dashboard shows what happened. AI analytics tells you why it happened, what happens next, and what you should do about it. The difference isn't visual — it's structural. It's the difference between a thermometer and a doctor.
If your team is still exporting dashboards to Excel, writing SQL queries by hand, and guessing which metric matters today — you don't have an analytics problem. You have a decision bottleneck.
This article explains what AI analytics actually is, how it differs from traditional BI, and what it looks like in practice.
AI Analytics vs Traditional BI: The Real Difference
What Traditional BI Does
Traditional BI tools — Power BI, Tableau, Looker — were built for reporting. You connect a data source, build a dashboard, and share it with your team. The workflow looks like this:
- Data engineer prepares the dataset
- Analyst builds the dashboard
- Manager looks at the dashboard
- Manager asks a follow-up question
- Analyst goes back to step 2
This cycle can take hours, days, or weeks. The dashboard answers the question it was designed for. Every new question requires a new dashboard.
What AI Analytics Does
AI analytics tools — like LivChart — were built for understanding. You connect a data source, ask a question in plain language, and get an answer with a chart. The workflow looks like this:
- You type: "Which product category had the highest return rate in Q1?"
- AI generates the chart and the explanation
- You ask a follow-up: "What's the common reason for returns in that category?"
- AI answers again — in seconds
No dashboard to build. No SQL to write. No analyst bottleneck.
The Structural Difference
| Aspect | Traditional BI | AI Analytics |
|---|---|---|
| Primary input | Dashboard design | Natural language question |
| Who can use it | Analysts, data team | Anyone in the company |
| Time to insight | Hours to weeks | Seconds |
| Follow-up questions | New dashboard needed | Ask immediately |
| Data preparation | Manual ETL, modeling | Automatic detection |
| Output | Static chart on a dashboard | Chart + explanation + recommendation |
| Adaptability | Rigid — built for specific questions | Flexible — handles any question |
| Learning curve | Weeks of training | Minutes |
How AI Analytics Works: The 5-Layer Stack
Layer 1: Data Connection
AI analytics starts where your data lives. LivChart connects to:
- Excel & CSV files — drag and drop, no import wizard needed
- SQL Server, PostgreSQL, MySQL — direct database connection, no middleware
- Any ODBC source — for enterprise data warehouses
The key difference: you don't need to build a data model first. The AI reads your schema, understands column relationships, and figures out what your data means.
Layer 2: Intent Understanding
When you type "Show me sales by region last quarter," the AI does three things:
- Parses your intent — you want sales data, grouped by region, filtered to last quarter
- Maps to your data — finds the
salestable, theregioncolumn, thedatefield - Generates the query — writes the SQL (or DataFrame operation) to get exactly what you asked for
This is not keyword matching. It's semantic understanding. You can say "Which customers are at risk of churning?" and the AI knows to look at purchase frequency, recency, and revenue trends.
Layer 3: Analysis & Computation
The AI doesn't just fetch data — it analyzes it. Depending on your question, it can:
- Calculate trends and growth rates
- Identify outliers and anomalies
- Perform cohort analysis
- Run correlation checks
- Segment your data automatically
You don't need to know which statistical method to use. The AI selects the right approach based on your question and data type.
Layer 4: Visualization & Explanation
This is where AI analytics separates from dashboards forever. The output isn't just a chart — it's a chart with context:
- What the data shows
- Why it matters
- What you should consider doing next
- What data limitations apply
A dashboard shows you a line going down. AI analytics tells you: "Revenue dropped 12% in March, primarily driven by the EMEA region. The top contributor is the loss of 3 enterprise accounts worth $240K combined. Consider reviewing your renewal pipeline for Q2."
Layer 5: Action & Export
The final layer turns insight into action:
- PDF Reports — generate branded, presentation-ready reports with one click
- Dashboard sharing — save your AI-generated charts as interactive dashboards
- Scheduled analysis — set up recurring checks on key metrics
- Alerts — get notified when metrics cross thresholds you define
5 Real-World Use Cases
1. Sales Pipeline Health
Question: "Which deals in our pipeline are most likely to close this quarter?"
What AI analytics does: Analyzes deal size, stage duration, rep win rate, and historical close patterns. Ranks your pipeline by probability and highlights at-risk deals. Suggests which deals need attention.
Traditional BI equivalent: A pipeline dashboard that shows stage distribution. You still have to manually assess each deal.
2. Customer Churn Prediction
Question: "Which customers haven't ordered in the last 90 days?"
What AI analytics does: Identifies customers with declining order frequency, shrinking order values, and reduced product variety. Flags them as churn risks before they actually leave.
Traditional BI equivalent: A static list you'd have to export and manually analyze. By the time you notice, the customer is already gone.
3. Inventory Optimization
Question: "Which products should we reorder next week?"
What AI analytics does: Looks at current stock levels, average daily sales, lead times, and seasonal patterns. Calculates reorder points and suggested order quantities.
Traditional BI equivalent: An inventory dashboard showing stock levels. You do the reorder math yourself.
4. Financial Anomaly Detection
Question: "Are there any unusual transactions this month?"
What AI analytics does: Scans transaction data for statistical outliers — amounts that deviate from patterns, duplicate entries, timing anomalies. Highlights them with confidence scores.
Traditional BI equivalent: You'd need to build custom alert rules for every scenario. Miss one, and it goes undetected.
5. Marketing ROI Analysis
Question: "Which marketing channels brought the most qualified leads last quarter?"
What AI analytics does: Joins marketing spend data with lead quality scores and conversion rates. Calculates cost-per-qualified-lead by channel. Ranks channels by efficiency, not just volume.
Traditional BI equivalent: A marketing dashboard showing spend vs. clicks. The "qualified" part requires manual analysis.
"But My Team Already Uses Power BI"
This is the most common objection. Here's the reality:
Power BI is excellent for what it was built for: scheduled reporting on known questions. If your team already knows exactly what they need to see every Monday morning, Power BI delivers.
But here's what Power BI cannot do:
- Answer a question you didn't design a dashboard for
- Explain why a metric changed without manual investigation
- Let your sales team, HR, or operations self-serve data without SQL knowledge
- Run analysis on your local machine without sending data to Microsoft's cloud
The hybrid approach — and this is what most LivChart users do — is:
- Keep Power BI for your established, scheduled reports
- Use LivChart for ad-hoc questions, exploratory analysis, and teams that don't have BI access
- Gradually shift reporting to LivChart as your team gets comfortable with natural language queries
You don't replace Power BI overnight. You augment it.
AI Analytics Isn't Optional Anymore
Three shifts make AI analytics a necessity, not a luxury:
1. Data volume is exploding. The average mid-size company generates 10x more data than five years ago. Manual dashboard design can't keep up.
2. Decision speed matters. Your competitor using AI analytics answers in seconds what takes your team a week of dashboard building.
3. Data privacy is non-negotiable. Sending your data to a cloud AI tool creates compliance risk. Local AI analytics — where data never leaves your network — is the only model that scales without creating new problems.
The companies that treat AI analytics as "just a better dashboard" will keep building dashboards. The ones that understand it as a new way to interact with data will make faster decisions, with more people, and without compliance headaches.
Getting Started with AI Analytics
If you're evaluating AI analytics for your team, here's a practical path:
Week 1: Try with Your Own Data
- Download LivChart (free Starter plan)
- Connect your most-used Excel file or database
- Ask 10 questions you normally wait days for your BI team to answer
- See if the quality of answers meets your expectations
Week 2: Expand to a Second Team
- Give access to your sales, HR, or operations team
- Let them ask their own questions without training
- Measure how many ad-hoc requests your BI team no longer receives
Week 3: Compare the Cost
- Count hours your team spends building and updating dashboards
- Count hours your team spends waiting for answers
- Compare against LivChart's cost — including the free Starter plan for unlimited local analysis
The fastest way to understand AI analytics is to use it. Download LivChart, connect your data, and ask one question you've been waiting to get answered.
LivChart is an AI analytics platform that lets you ask questions in plain language and get charts, explanations, and reports — without sending your data to the cloud. Download for free or try the live demo.