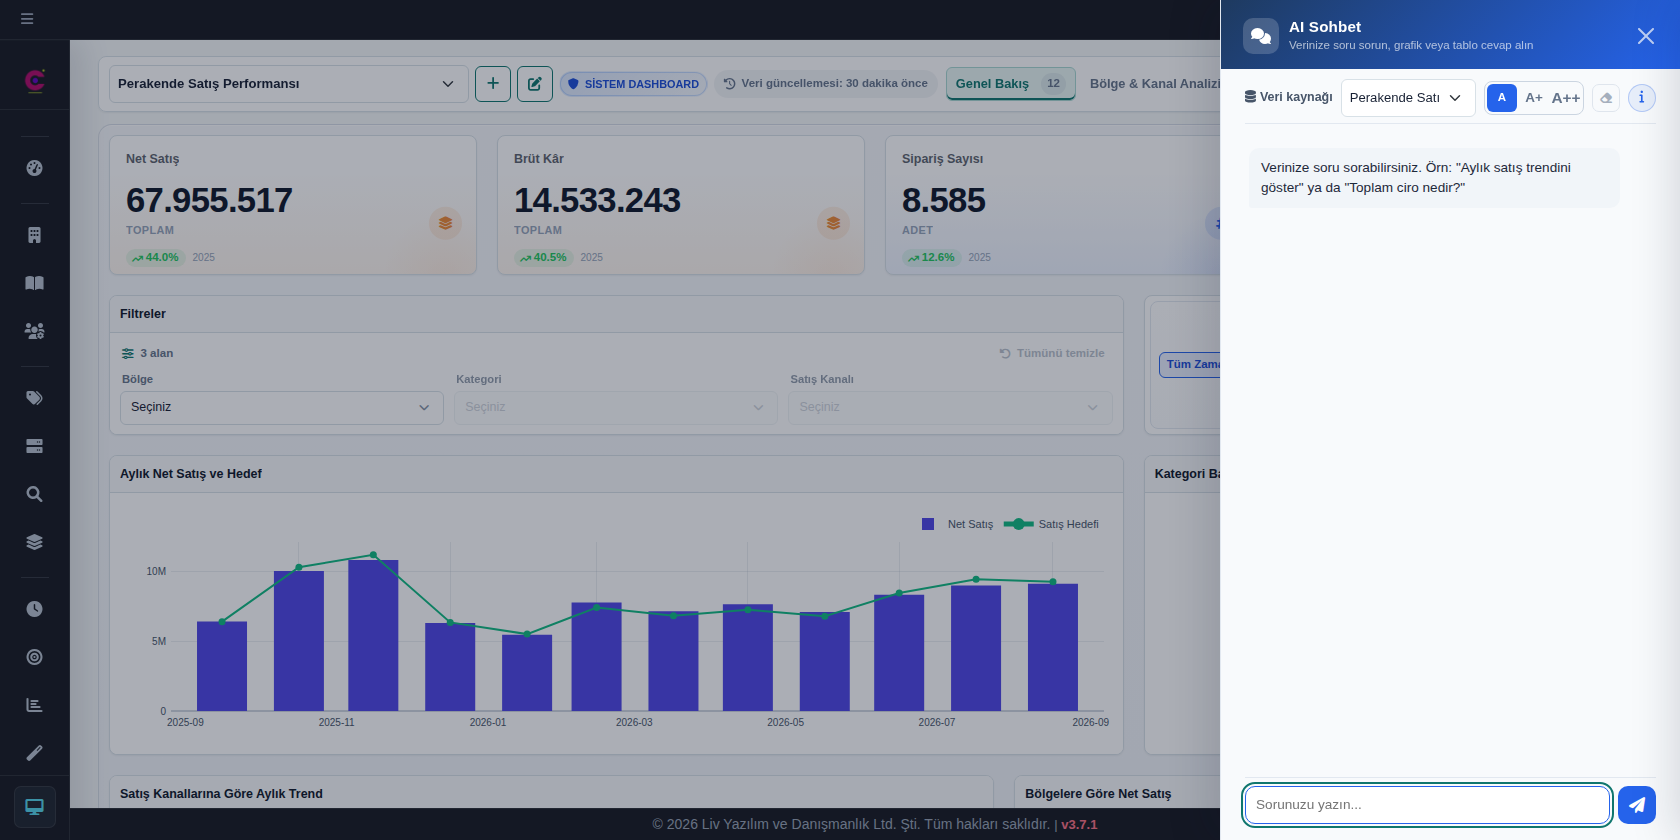
AI-powered data analysis is everywhere now. You type a question and seconds later you get a chart or a fluent answer. But when a number lands on the table in an executive meeting, the real question isn’t speed. It’s this: Is this number right?
AI models are remarkable with language, but adding up a table row by row, applying a filter without missing anything, or averaging tens of thousands of rows flawlessly is not what they are built for. A model can “compose” a number the same way it composes a sentence. A figure that sounds convincing but has no basis in your data is more dangerous than an obvious mistake, because nobody notices it.
That’s why we built LivChart around one simple principle: AI understands your question; LivChart calculates the number from your data.
AI interprets, LivChart calculates
When you ask “Which region grew the most in 2026?”, the AI’s job is to understand what you mean: which measure, which period, which breakdown. Totals, averages and comparisons are computed by LivChart’s own calculation engine, not by the AI.
- No sampling: Calculations run over your entire dataset, not a small slice of it.
- Live every time: When a dashboard opens or a question is asked, results are recalculated from current data.
- Consistency: A saved chart or dashboard returns the same result on the same data every time it opens.
You read the number from the result, not the commentary
When you ask for a single value (for example, “What is our total revenue this year?”), the exact result calculated from your data is shown right next to the answer. The AI’s text is commentary that explains that result; it is not the number itself.
Even more importantly, the numbers in the AI’s answer are checked against the calculated result. If a number doesn’t match, you are told clearly and the answer’s trust score drops accordingly. Errors are not hidden; they are made visible.
Every answer shows how it was calculated
The best way to trust a number is to see where it comes from. With every answer, LivChart transparently shows:
- Which data source was used and how many rows were included
- The filters applied and the calculation used (sum, average, count…)
- When the data was last refreshed
- A trust score that summarizes how reliable the answer is
So when you present a figure, “where did this come from?” has a one-click answer.
Missing data is not the same as zero
Accuracy isn’t only about calculating correctly; it also means being honest about what isn’t shown. That’s why LivChart:
- Never shows a period with no data as “0”. It keeps “no data” and a real zero apart.
- Says so on the chart when only the top categories are shown for readability, and groups the rest under “Other” so the total is never lost.
- Interprets date filters correctly across different date formats.
Accuracy tested in every release
Accuracy isn’t a feature you build once and forget. In every release, LivChart’s results are compared with independently computed values across hundreds of automated tests. Charts, pivot tables, filters and dashboard components don’t ship until they pass.
Accuracy comes with security
Protecting your data matters as much as getting the numbers right. When an online AI provider is used, you first approve what data is sent to the AI, and identifying information is masked before anything leaves; both steps are mandatory, not optional. If you want your data to never leave your organization, you can run LivChart with local AI models on your own servers.
The bottom line: the right answer, not just a fast one
AI analytics tools are multiplying fast. What makes the difference isn’t how quickly an answer arrives, but how much you can trust it. With LivChart, AI saves you time while the numbers always come from your data.
Try it with your own data in the demo on the LivChart home page, or get in touch with us.