In today’s fast-paced business world, decisions are no longer driven by intuition but by real-time data. However, keeping data trapped on desktop screens creates a bottleneck for managers in the field or teams on the move. LivChart eliminates this obstacle with its dual-layer design interface: Create comprehensive desktop dashboards and optimize them for mobile devices in seconds.
Why "Mobile-Designed" Matters More Than "Mobile-Responsive"
Many Business Intelligence (BI) tools claim to be "responsive." However, trying to view a complex production table or a multi-column chart on a phone screen often feels like getting lost in a maze.
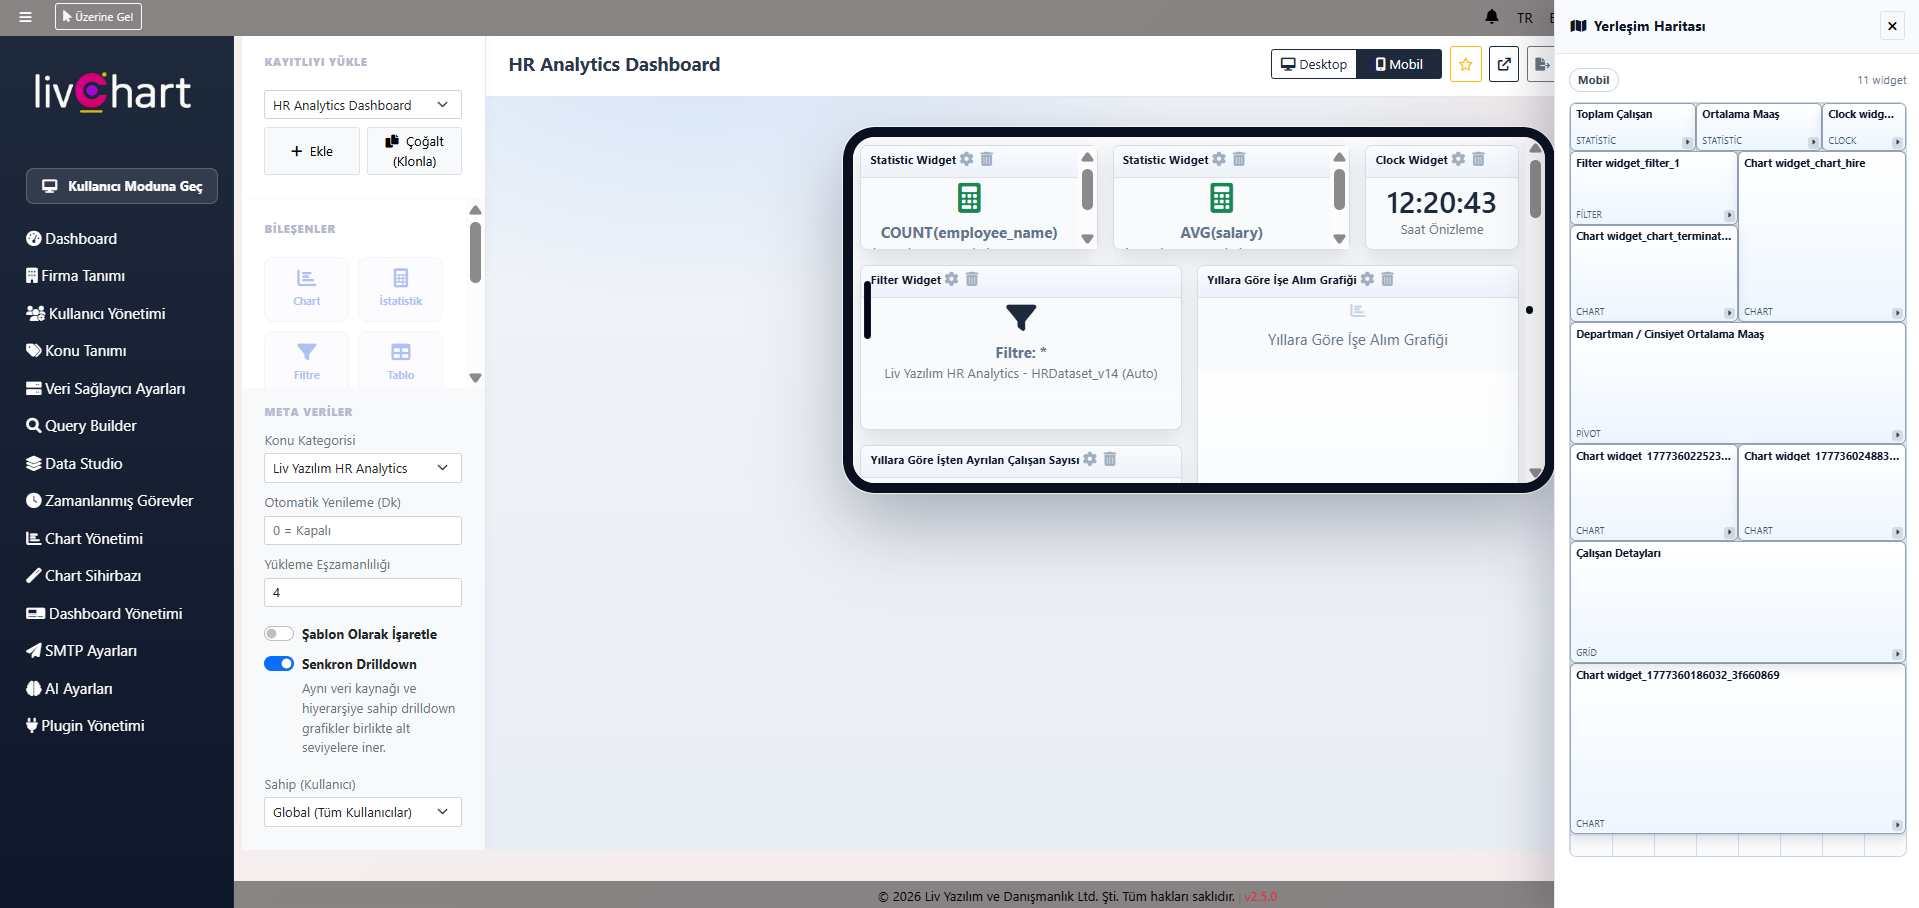
What sets LivChart apart is its dedicated Mobile Design Panel. This specialized workspace allows you to:
- Prioritize Key Metrics: Select only the most critical 3 charts out of 10 from your desktop view to display on mobile.
- Control the Layout: Build a horizontal, optimized flow specifically for touch-and-scroll navigation.
- Enhance Readability: Hide eye-straining details on small screens and highlight only the "decision-making" figures.
Creative Freedom: Drag, Drop, and Deploy
You don’t need to be a software developer to design a dashboard in LivChart. Our No-Code architecture enables users of all technical levels to create professional reports using a simple drag-and-drop method.
While performing deep data mining on the desktop panel, you can transform that data into "insight cards" on the mobile panel. This ensures that a plant manager on the factory floor or a sales director en route to a meeting can check the company’s pulse simply by pulling out their phone.