
In today's business world, data has become the most valuable asset. However, the biggest obstacles encountered when analyzing this data with artificial intelligence are "data privacy" and "security" concerns. Most cloud-based AI solutions require your sensitive data to leave the company premises. LivChart, through its Ollama integration, solves this problem fundamentally by offering an ecosystem that ensures your data remains 100% local.
Step 1: The Local Powerhouse - Ollama and Gemma4
It all starts with a powerful language model running on your own machine. As seen in the visuals, through Ollama, we can deploy advanced models like gemma4:e2b in a matter of seconds.
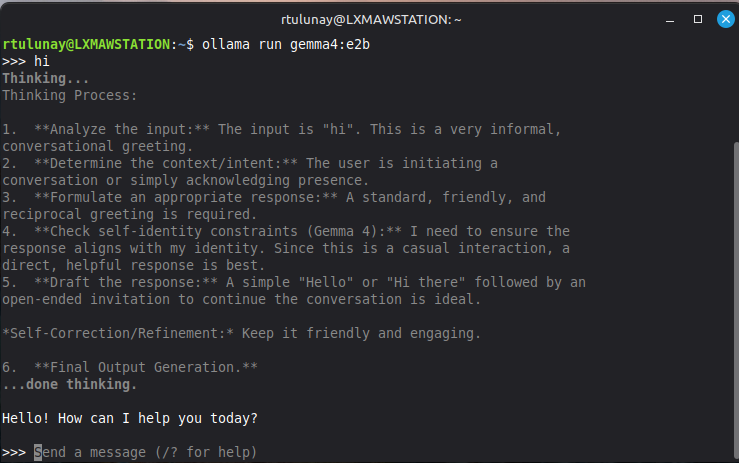
The "Thinking Process" output on the terminal screen demonstrates that the model doesn't just generate a response; it follows a logical sequence. This transparency and speed put the power of local resources (GPU/CPU) directly under your control.
Step 2: Seamless Integration with LivChart
The next stage after deploying your local model is connecting this power with your business data. LivChart's user-friendly interface allows you to define Ollama as an "AI Provider."
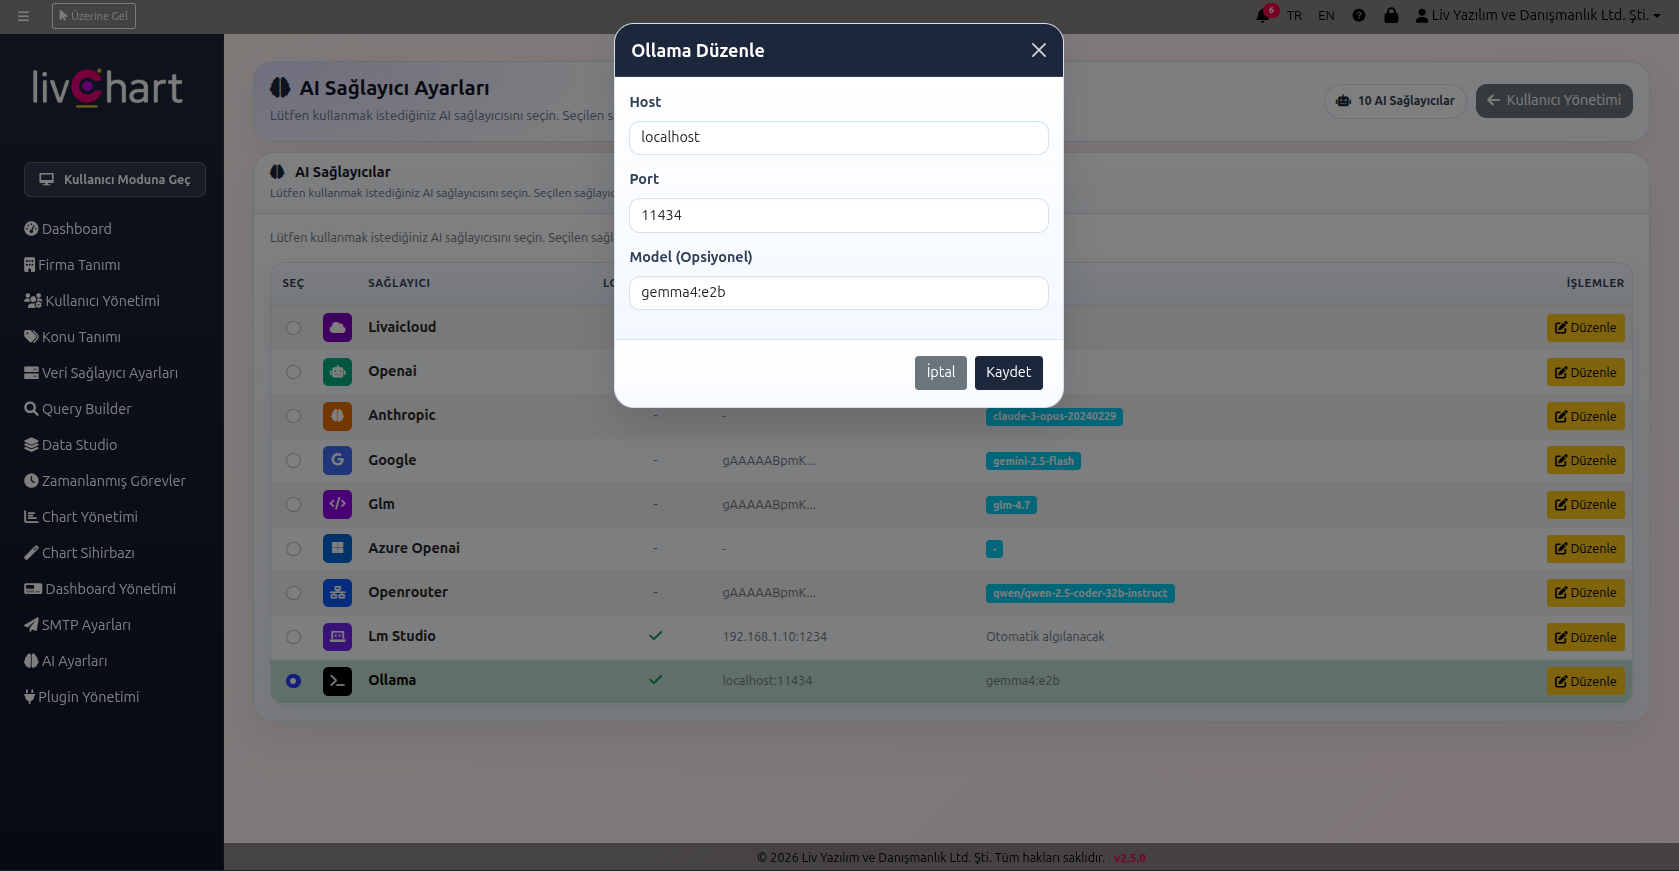
In the "AI Provider Settings" panel, establishing a connection with Ollama via the localhost:11434 port is remarkably simple. As shown in the image, LivChart doesn't just support cloud giants like OpenAI or Google; it provides total freedom by supporting local alternatives such as Ollama, LM Studio, and Glm. This allows you to continue your data analysis even without an internet connection.
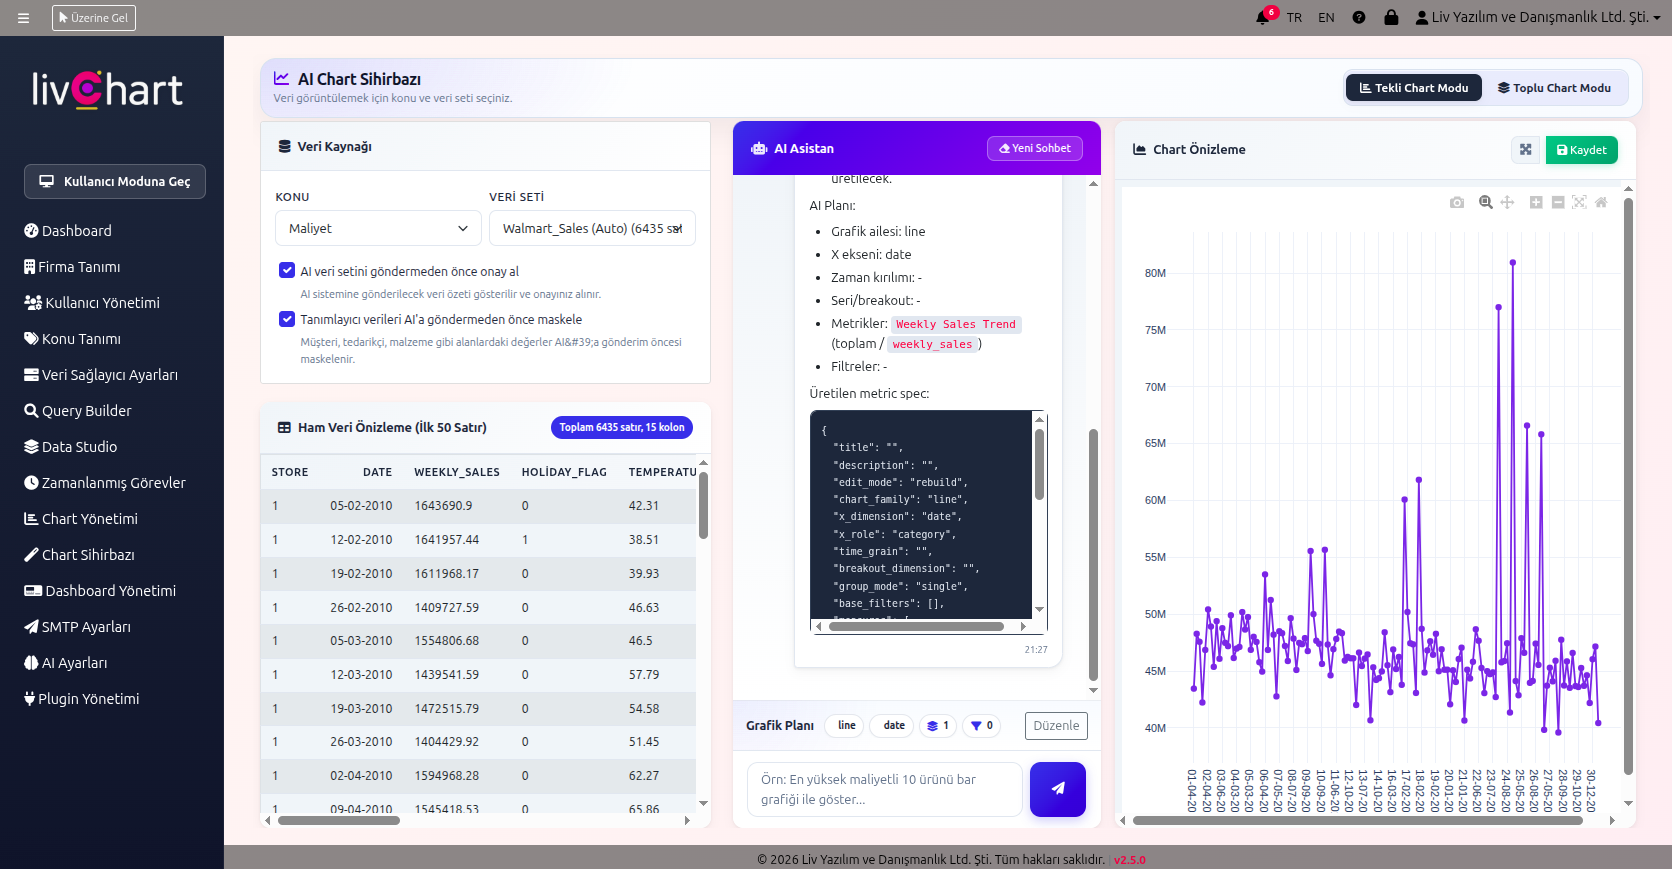
Step 3: From Data to Visual - AI Chart Wizard
Once the connection is established, the real magic happens on the "AI Chart Wizard" screen. Here, AI functions not just as a chatbot, but as a professional data analyst.
Taking the Walmart Sales dataset example from the visual:
- Masking and Security: With the "Mask identifying data" option, customer or private information is filtered before being shared with the model.
- Natural Language Querying: When a user requests a "Weekly Sales Trend," the local AI understands the request, prepares the SQL or Python code in the background, and generates an interactive chart in seconds.
- Live Preview: The Weekly Sales Trend chart generated in the right panel is the most concrete proof of how quickly and accurately the data is interpreted.
Conclusion: Why Local AI and LivChart
The summary of these three steps is simple: Gaining speed without compromising security. The collaboration between LivChart and Ollama offers businesses the opportunity to utilize all the benefits of modern AI without the risk of uploading data to the cloud. Predicting the future is now much easier—on your own server, by your own rules, and most importantly, with your own data.